- 11 Nov 2024
- 1 Minute to read
- Contributors

- Print
- DarkLight
Pulse User Interface
- Updated on 11 Nov 2024
- 1 Minute to read
- Contributors

- Print
- DarkLight
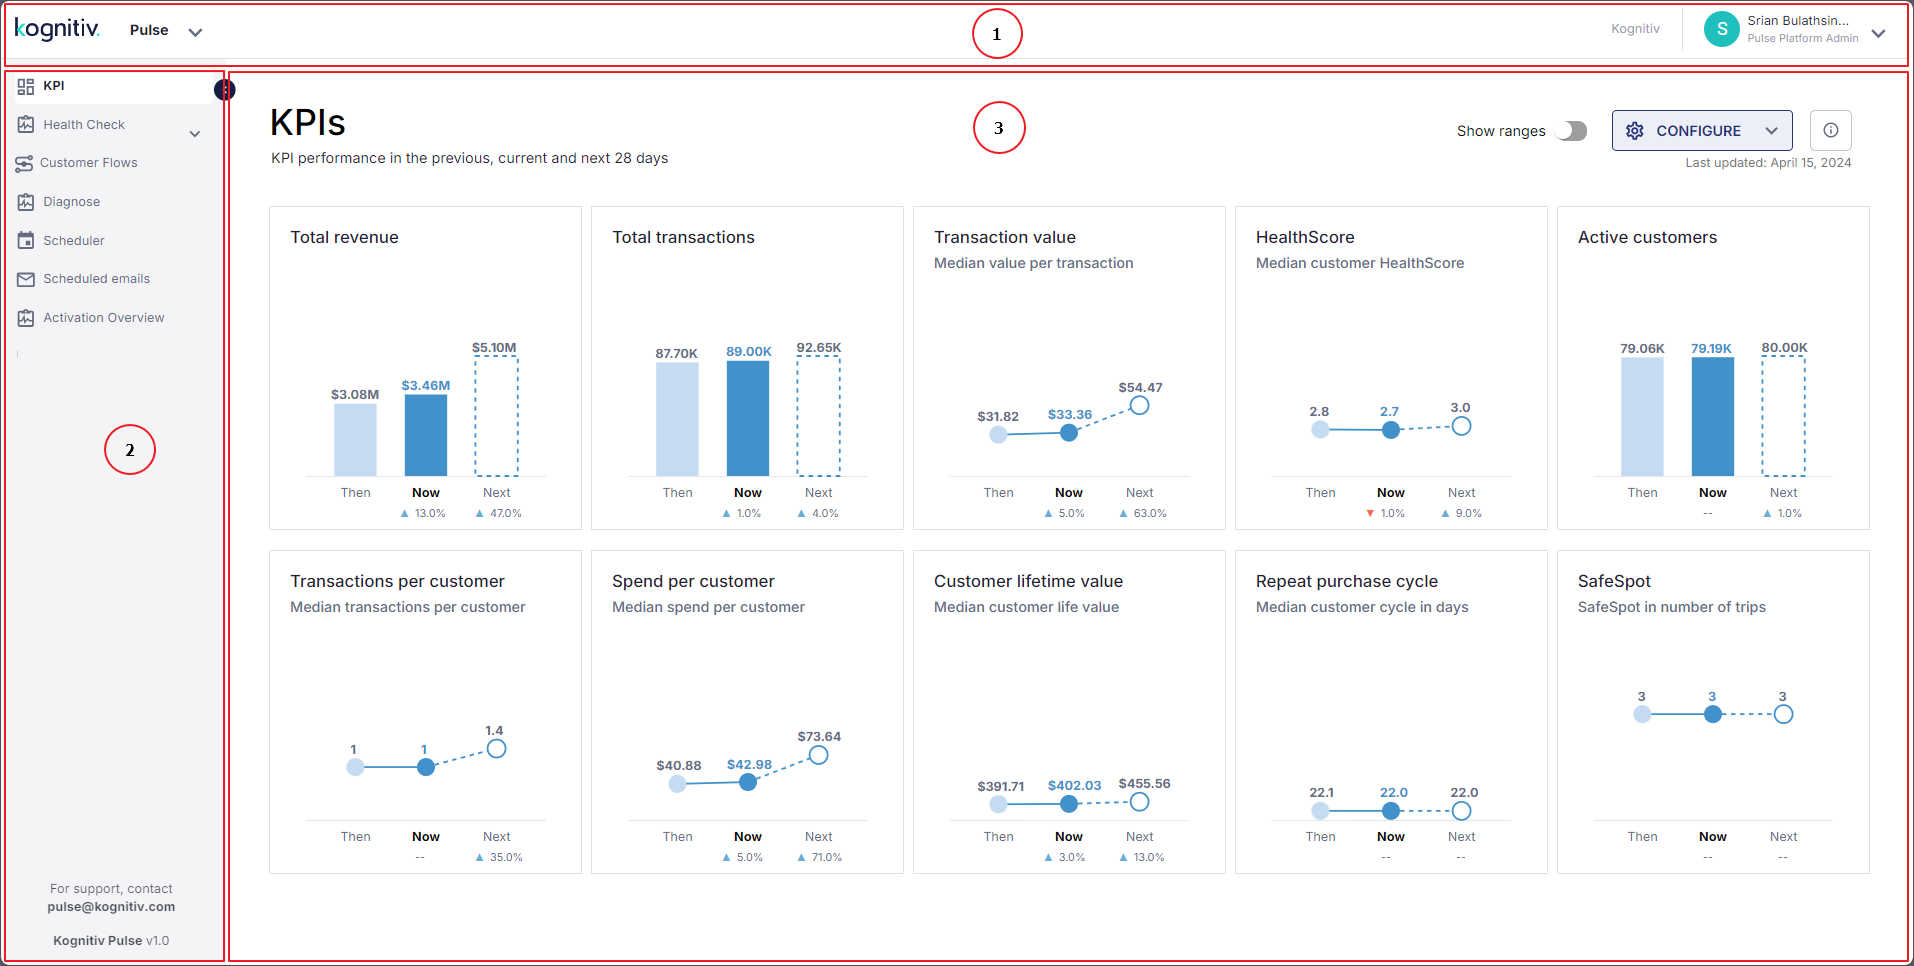
The user interface of Pulse is comprised of three main sections.

Top Panel
The top panel of Pulse will be common to all screens of the Pulse application. The top panel has the following components.
Component | Description |
|---|---|
Logo | Kognitiv logo. |
Pulse (Module Switch) | The dropdown will display the name of the current application. This dropdown lists the applications that the currently logged user can access. Select the application from the dropdown menu to load that application in the browser window. |
Tenant | Displays the name of the tenant organization/brand whose customer loyalty is analyzed using Pulse. |
User Profile | Displays the name and the role of the currently logged user. Click the user profile to open the user profile menu which lists the tenants and user roles associated with the current user profile. Depending on the tenant/role selected, the accessible pages and the data displayed within will change. |
Left Panel
The left panel displays the menu items that provide access to different data visualizations and configurations of the Pulse application.
Menu Item | Description |
|---|---|
KPI | Opens the KPIs page (See KPI). |
Health Check | Opens the Health Check page (See Health Check). |
Customer Flows | Opens the Customer Flows page (See Customer Flows). |
Diagnose | Opens the Diagnose page (See Diagnose). |
Scheduler | Opens the Schedule Audience page (See Scheduler). |
Scheduled Emails | Opens the Data Visualization Exports page (See Scheduled Emails). |
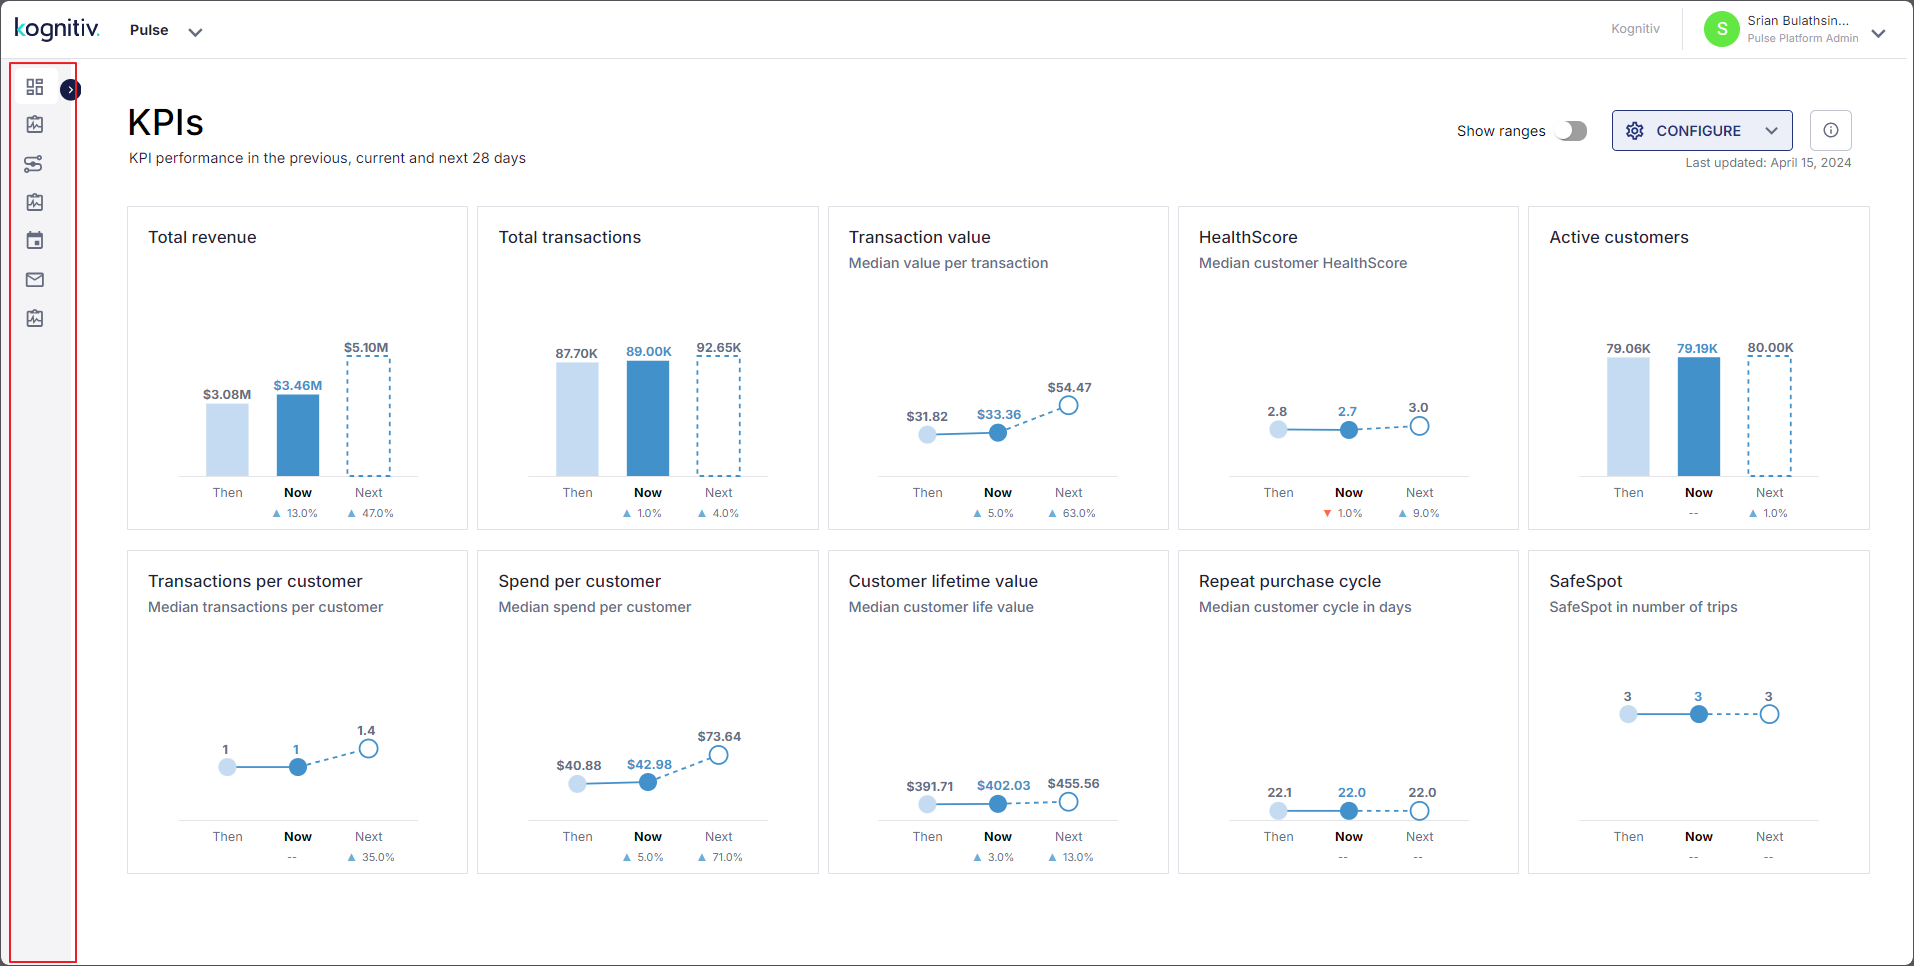
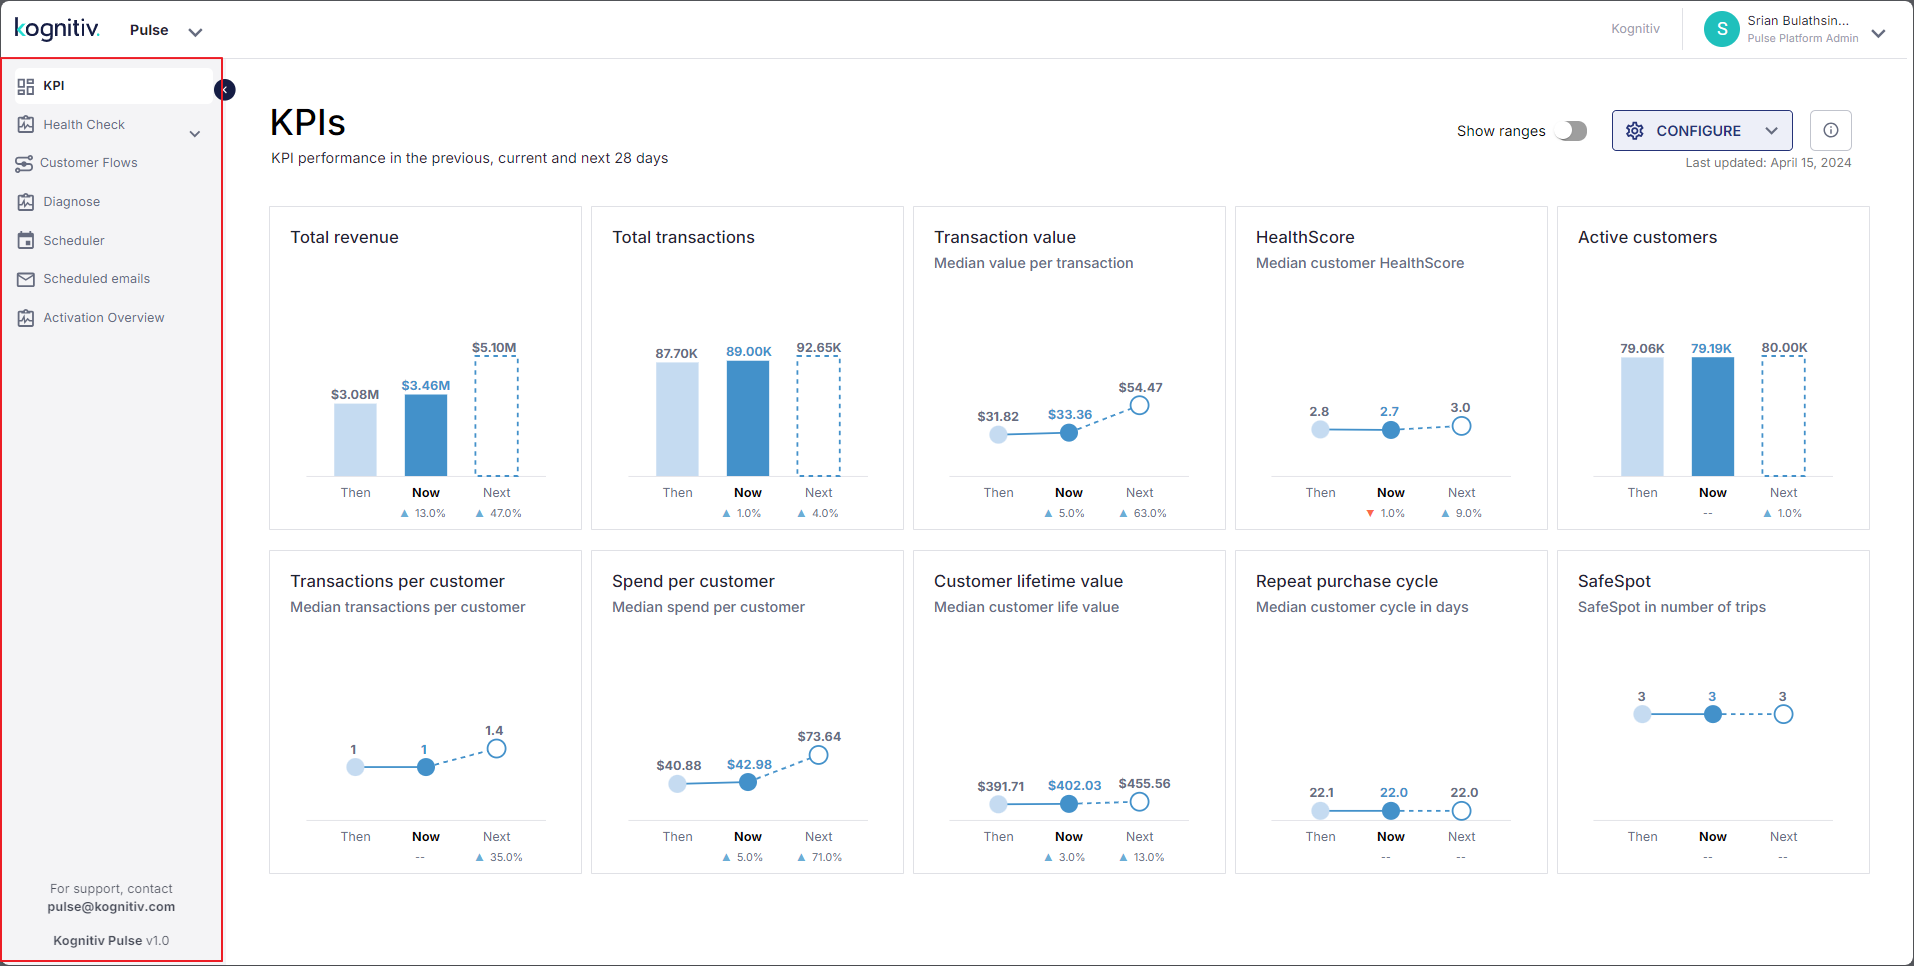
The left menu can be expanded/minimized via the adjacent right-pointing/left-pointing arrow.

Left Menu Minimized

Left Menu Expanded
The support contact details, and the application version will be displayed at the bottom of the left panel.
Data Panel
The data panel displays the data visualizations screens according to the option selected from the left panel menu.

