Click KPI to open the KPIs page.
KPIs Page
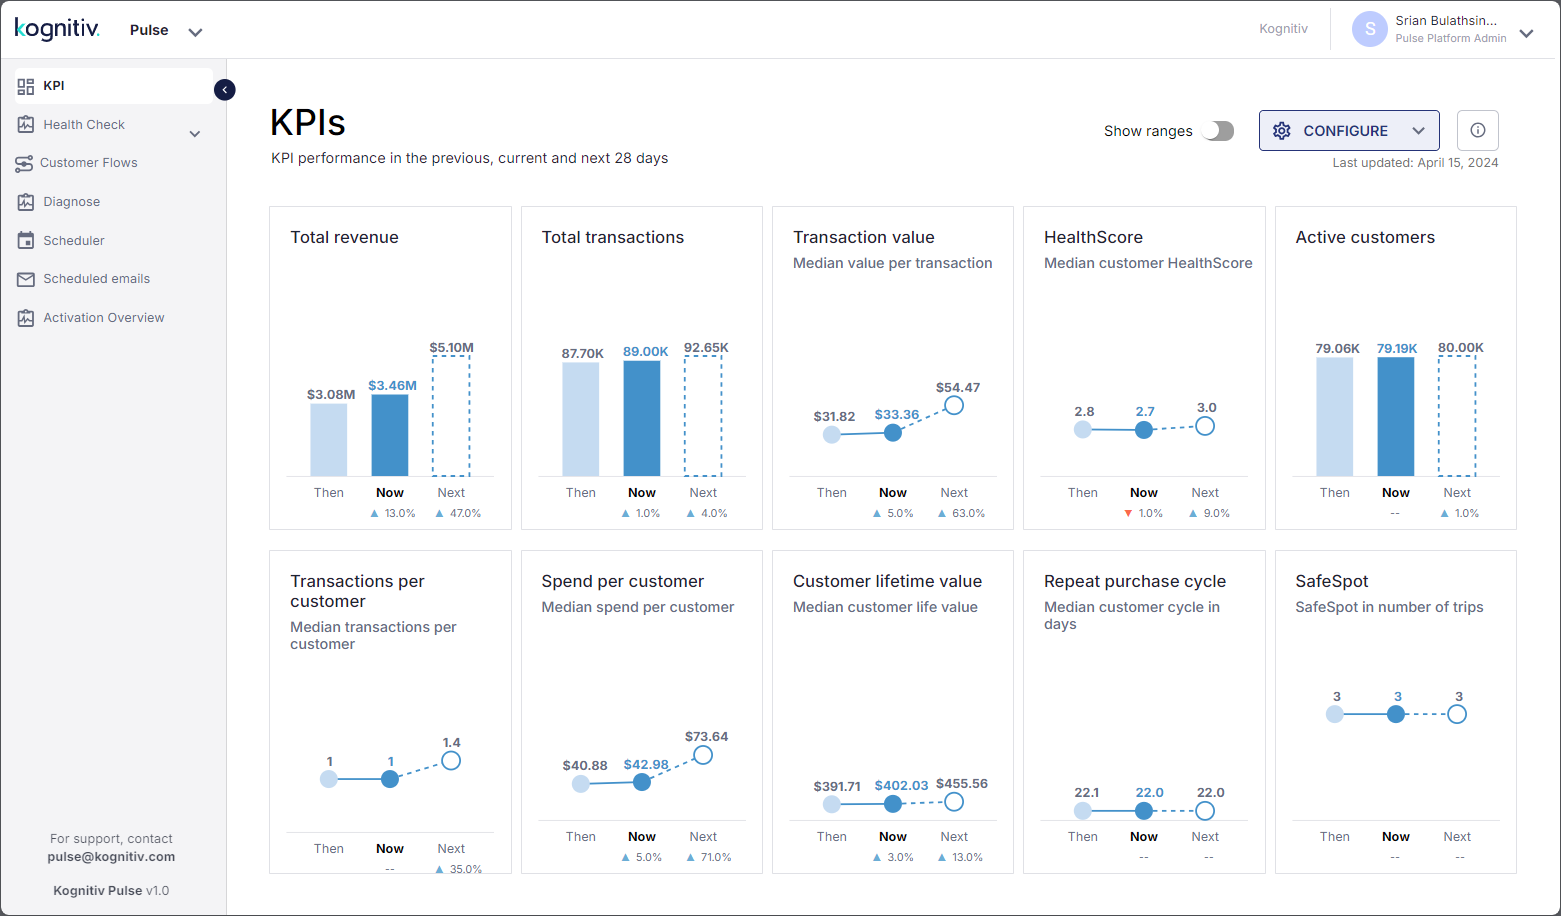
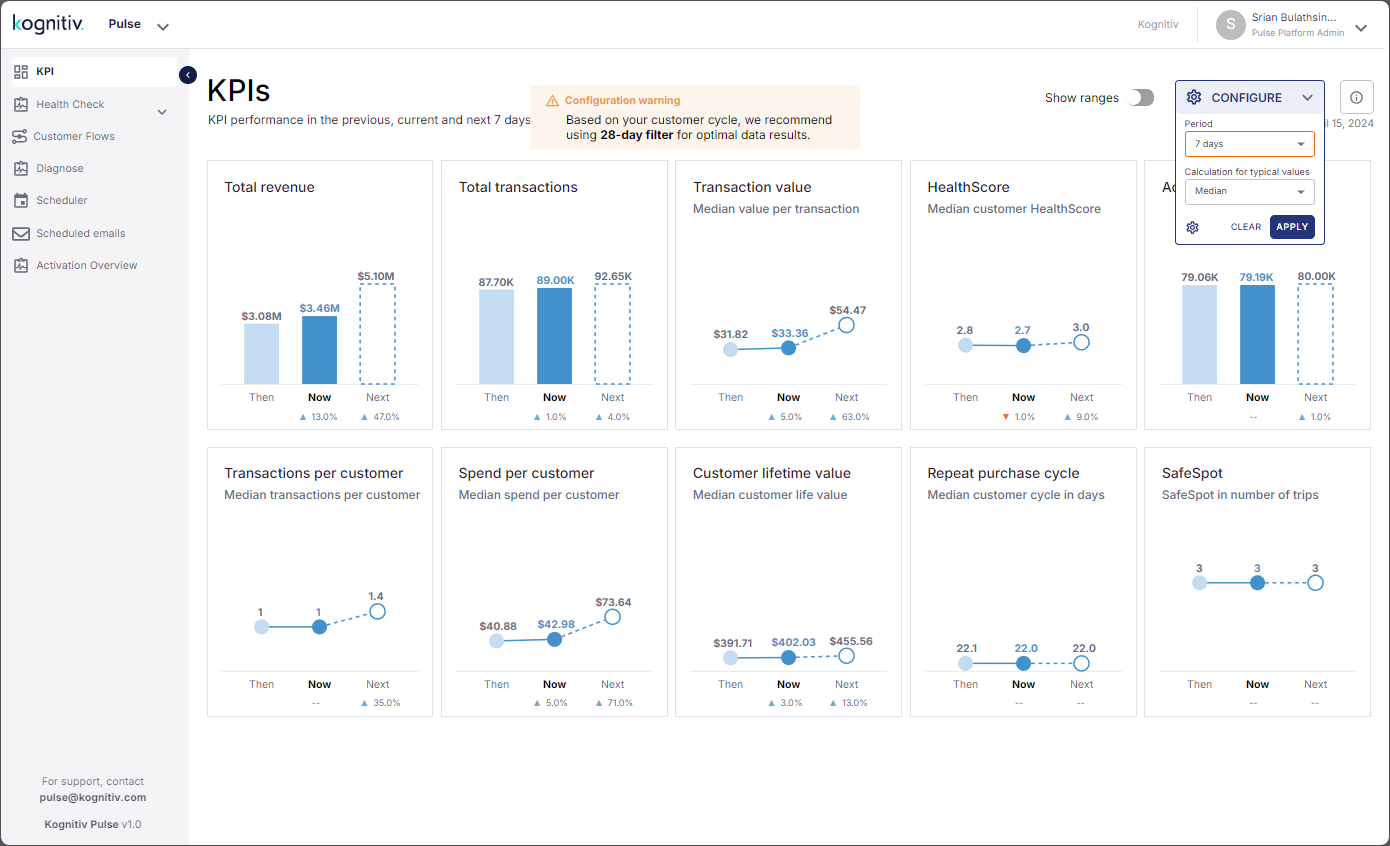
The KPIs page provides a dashboard view of the KPIs that are used in Pulse for assessing the customer-brand relationship status. Each tile will represent a KPI and will display data visualizations illustrating the KPI values in the previous and the current periods and the forecast for the next period. Pulse will use three colors to represent the three periods for clarity. At the base of each tile, the percentage of the negative changes and positive changes shown by the KPIs over the periods will be displayed according to the following format.
Red upward triangle (▲) indicates an increment that is a negative change (e.g., repeat purchase cycle).
Red downward triangle (▼) indicates a decrement that is a negative change (e.g., decreased revenue).
Blue upward triangle (▲) indicates an increment that is a positive change (e.g., increased profits).
Blue downward triangle (▼) indicates a decrement that is a positive change (e.g., decreased losses).
Hover over the tiles to view a short description of each KPI. Pulse will include the actual figures of the KPIs within the balloon text. In case the Show Ranges option is enabled, the popup balloon will also display the percentile information of the KPIs.
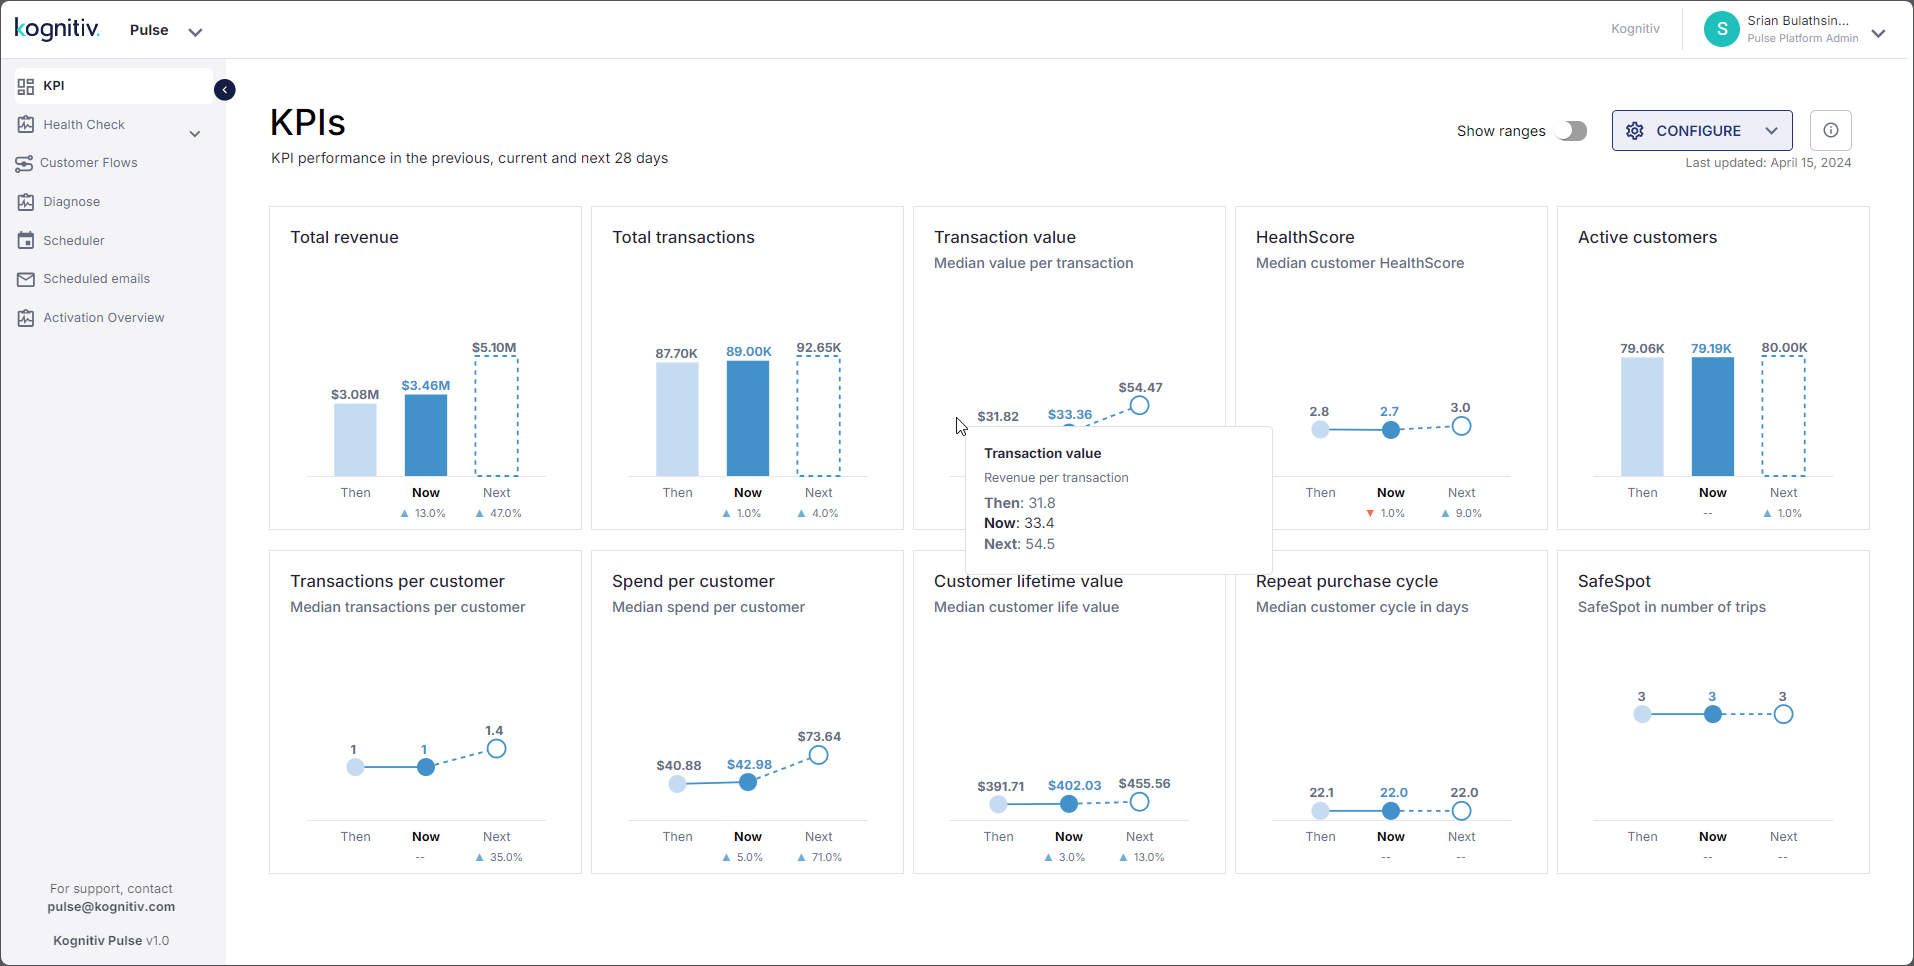
KPI Balloon Popup
The How to Read popup which can be accessed by clicking the 🛈 icon provides details on how to read and understand the data presented in the KPIs page (See How to Read).
The KPI visualizations are generated from the transaction data uploaded to the system. The Last Updated field will display the last transaction data upload date. The date of the last data upload will be considered as the last date of the current period.
By default, Pulse will assess the customer-brand relationship assessment for a period of 28 days and display the values of the KPIs for the past, current and future periods. The CONFIGURE dropdown provides options to change the default view (See Configure KPIs Page).
The Show Ranges toggle enables displaying range of values of the KPI from the 5th, 25th, 50th, 75th and 95th percentile of the customer base in the graphs and showing the related information of the KPIs within the hover over balloon text (See Enable/Disable KPI Ranges Display).
The tiles in the KPIs page represent the following KPIs.
KPI | Description | |
|---|---|---|
Total Revenue | The total revenue generated in the past and current periods and the total revenue forecast for the next period. | |
Total Transactions | The total number of transactions in the past and current periods and the expected total transaction count for the next period. | |
Transaction Value | The revenue generated per transaction in the previous and current periods and the expected revenue per transaction for the next period. | |
HealthScore | The HealthScore of the brand in the previous, current and next periods. | |
Active Customers | The total number of active customers in the customer base in the previous, current and next periods. | |
Transactions per Customer | The number of transactions per customer in the previous, current and next periods. | |
Spend per Customer | The amount spent per transaction in the previous, current and next periods. | |
Customer Lifetime Value | The Customer Lifetime Value (CLV) in the previous, current and next periods. | |
Repeat Purchase Cycle | The Customer Cycle duration (in days) in the previous, current and next periods. | |
SafeSpot | The SafeSpot value in the previous, current and next periods. |
How to Read
The 🛈 option will open the How to Read popup which provides instructions on how to read the data displayed in the KPIs page.
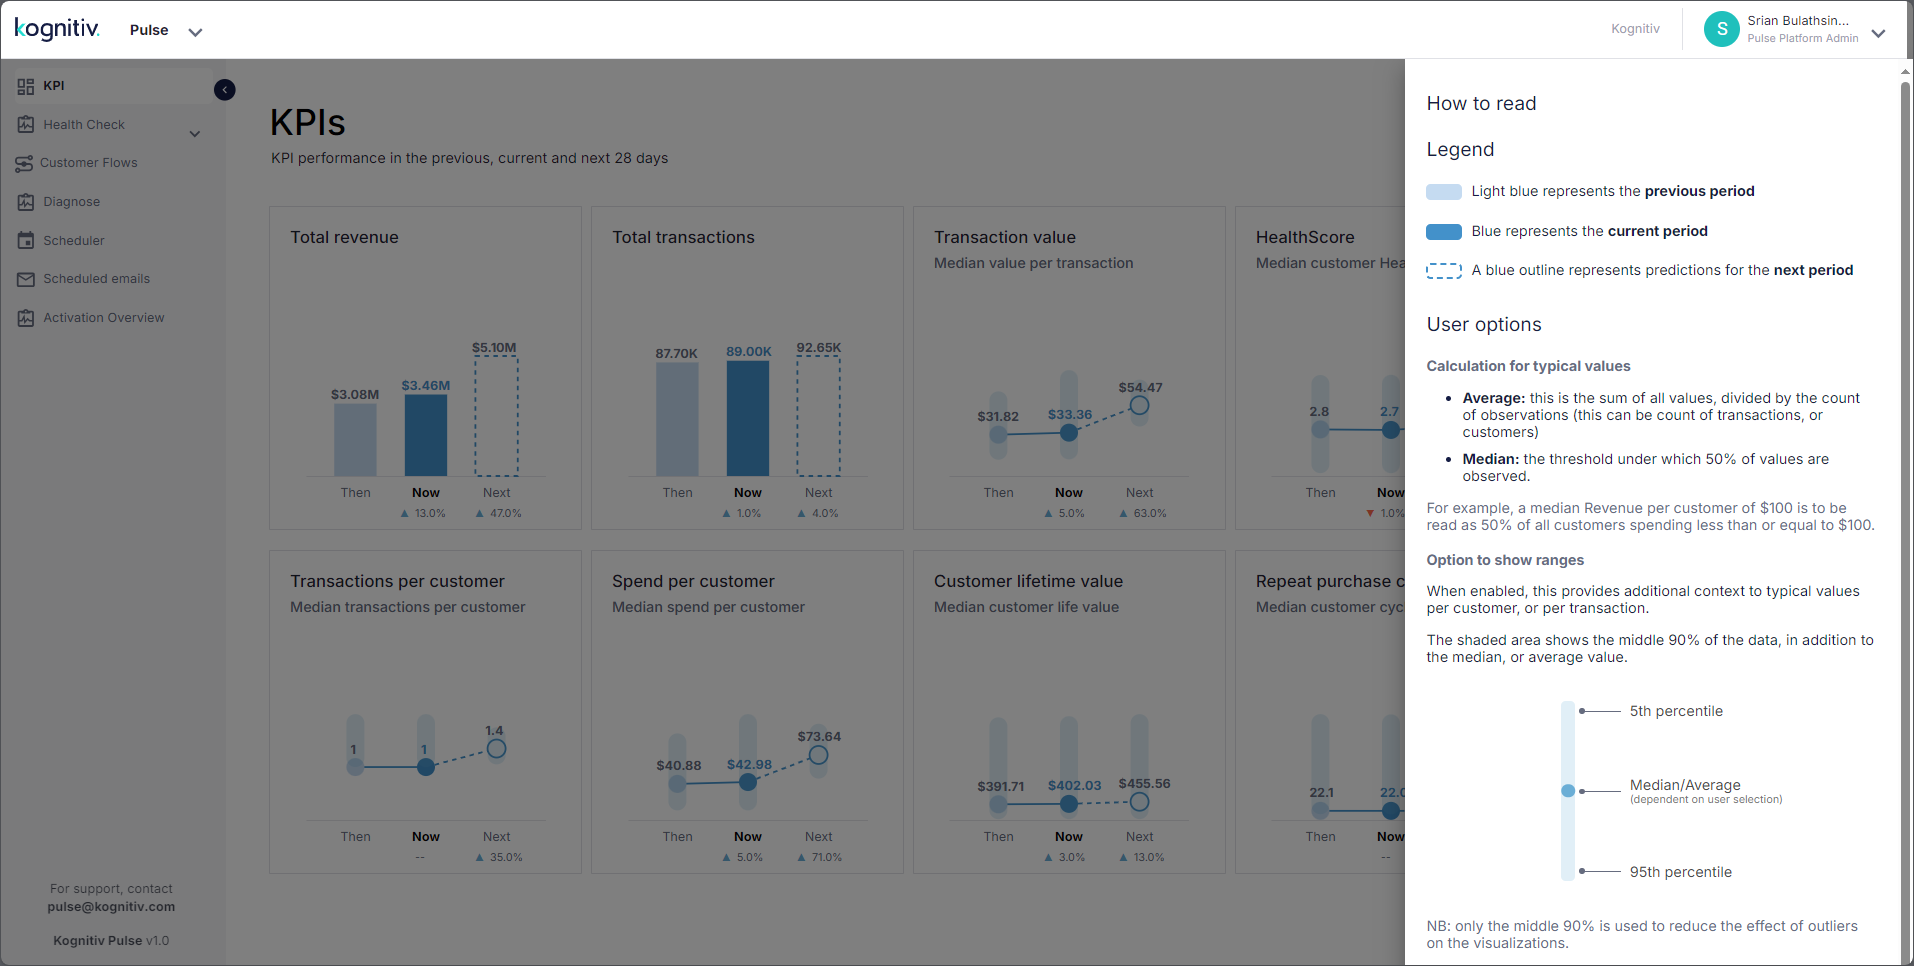
KPIs Page (How to Read Popup)
Click outside the dialog to close the How to Read popup.
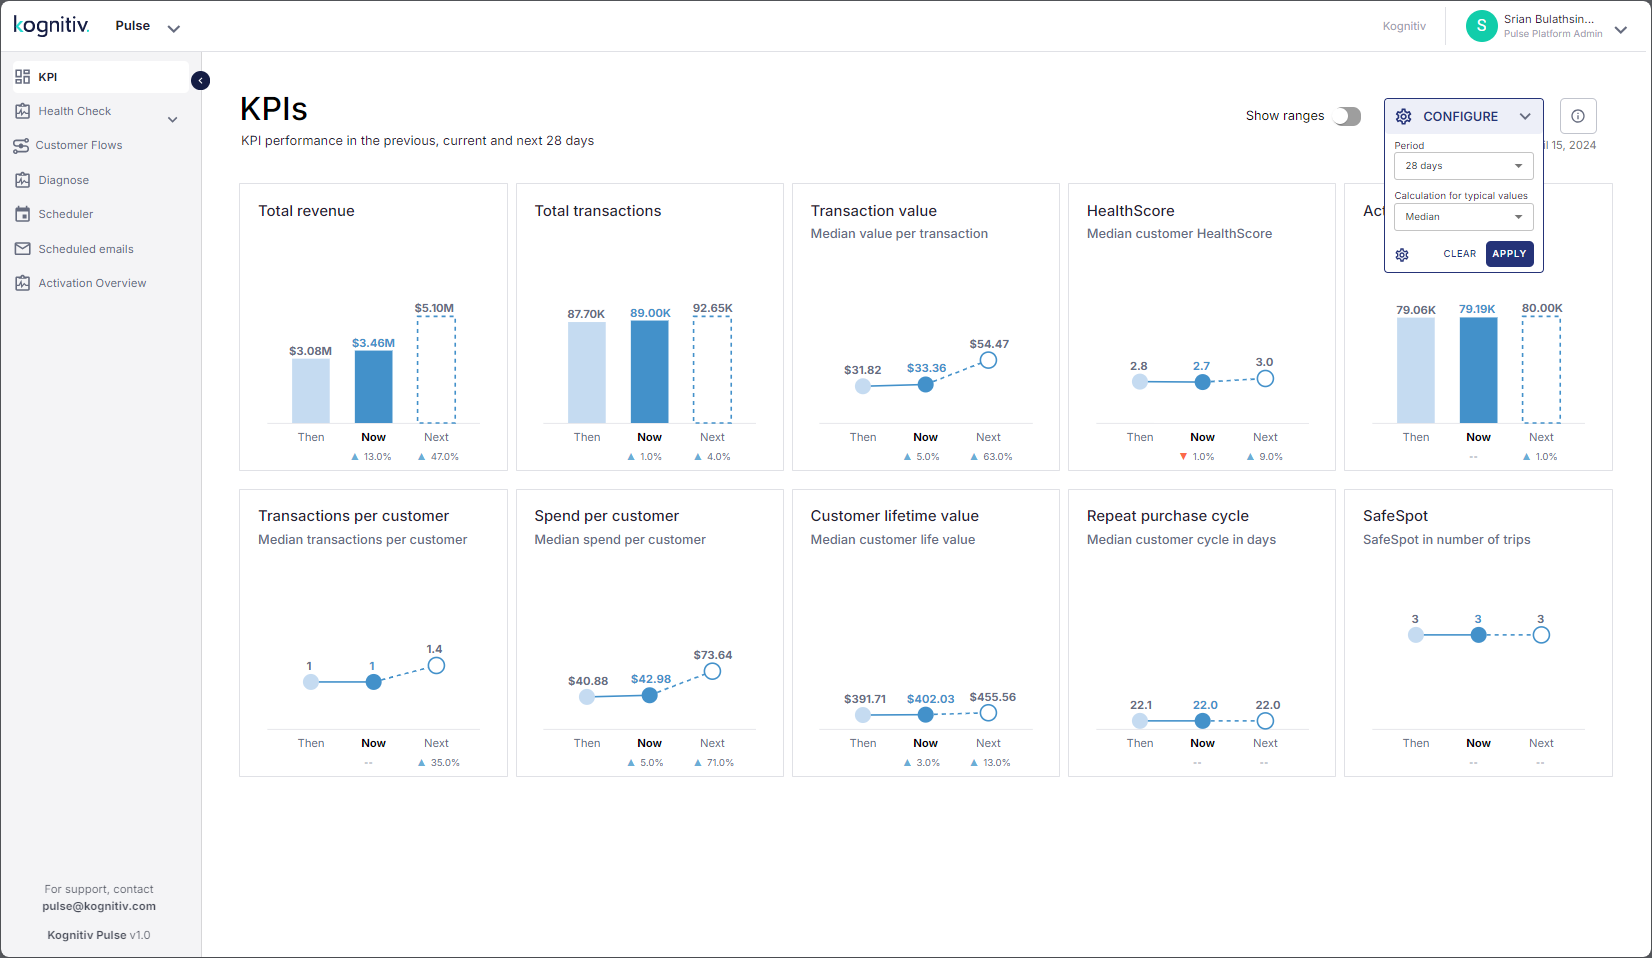
Configure KPIs Page
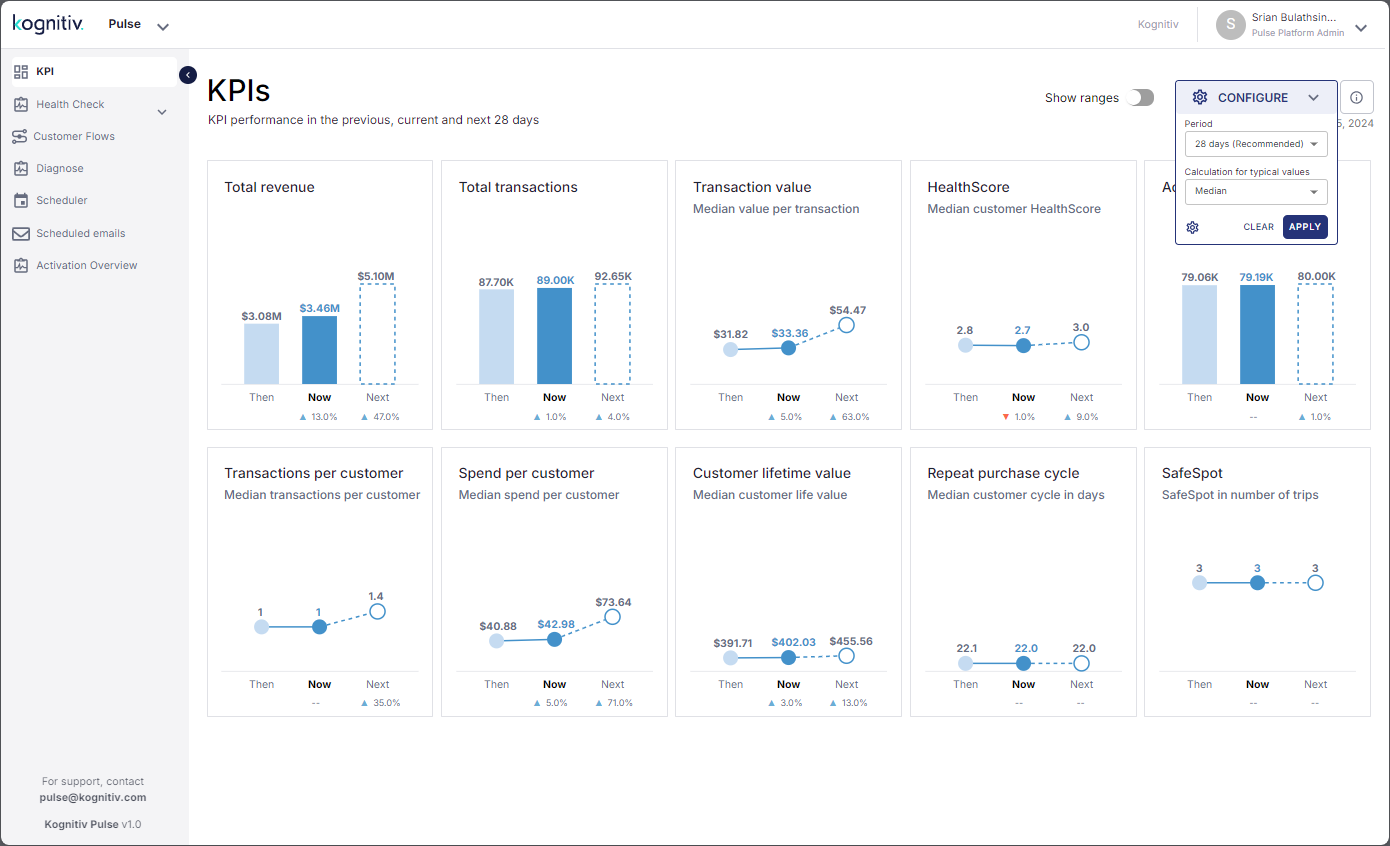
The CONFIGURE dropdown provides options to configure the data display of the KPIs page.
Setting the Duration for Customer-Brand Assessment
The Period dropdown is used for setting the duration of the customer-brand relationship assessment period in the KPIs page. The default duration is set to 28 days which is suited for most businesses. The other durations available for selection are, 7 days, 91 days and 182 days. Select the duration from the dropdown and click APPLY to apply the chosen duration in the KPIs page.
The duration of the assessment period is related to the Customer Cycle of the customer base. By analyzing the purchase data, Pulse calculates the customer cycle applicable for the customer base and recommends the suitable duration for the assessment in order to provide the best analysis and most relevant information. A shorter assessment period is suitable if the customer cycle is low, while a longer assessment period is recommended if the customer cycle value is high. A warning message will be displayed on the screen if an unsuitable duration is selected for the assessment period.
Warning to Unsuitable Duration for Assessment Period
Changing Default Assessment Period Duration
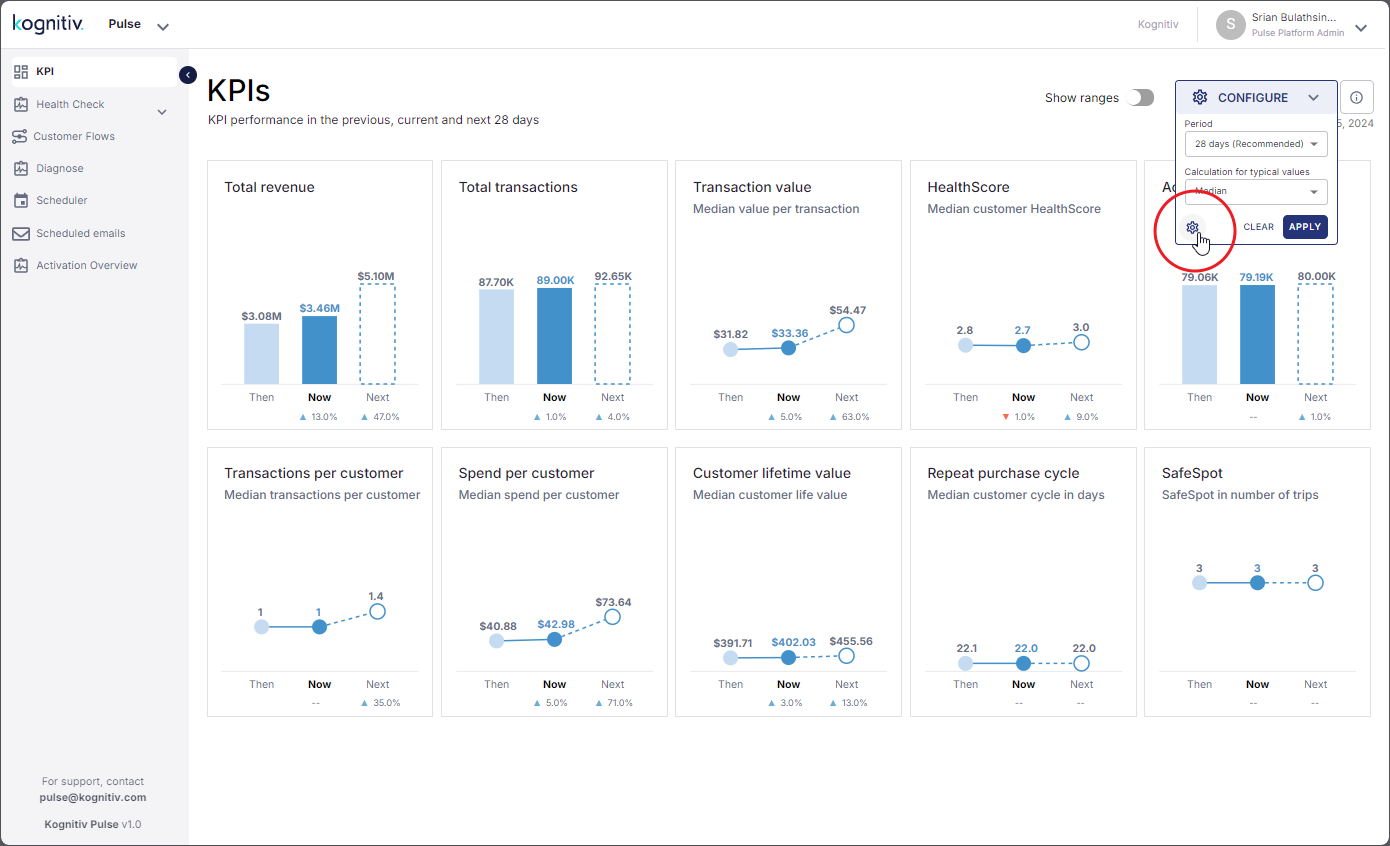
Changing the assessment period duration from the default 28 days via the Period submenu is not permanent (i.e., upon returning the KPIs page from to another page, Pulse will load the KPIs page with the default 28 day duration). To change the system default to a different duration, click on the gear icon at the base of the CONFIGURE dropdown.
This will open display the Default Configuration dialog.
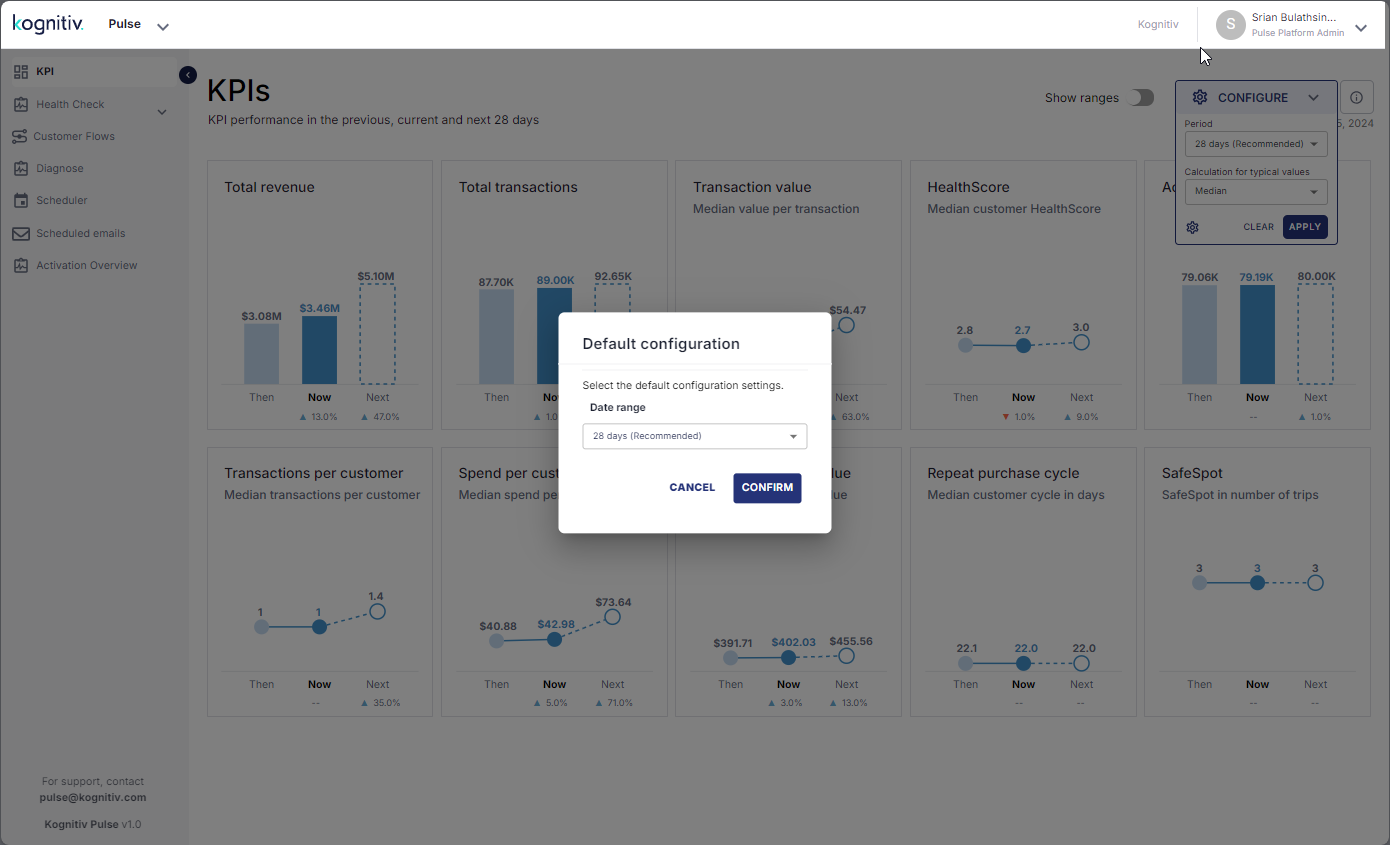
Default Configuration Dialog (KPIs Page)
To override the default deration for the assessment, select the preferred duration from the Date Range dropdown. Pulse will display a warning message if the chosen duration is different to the recommended duration.
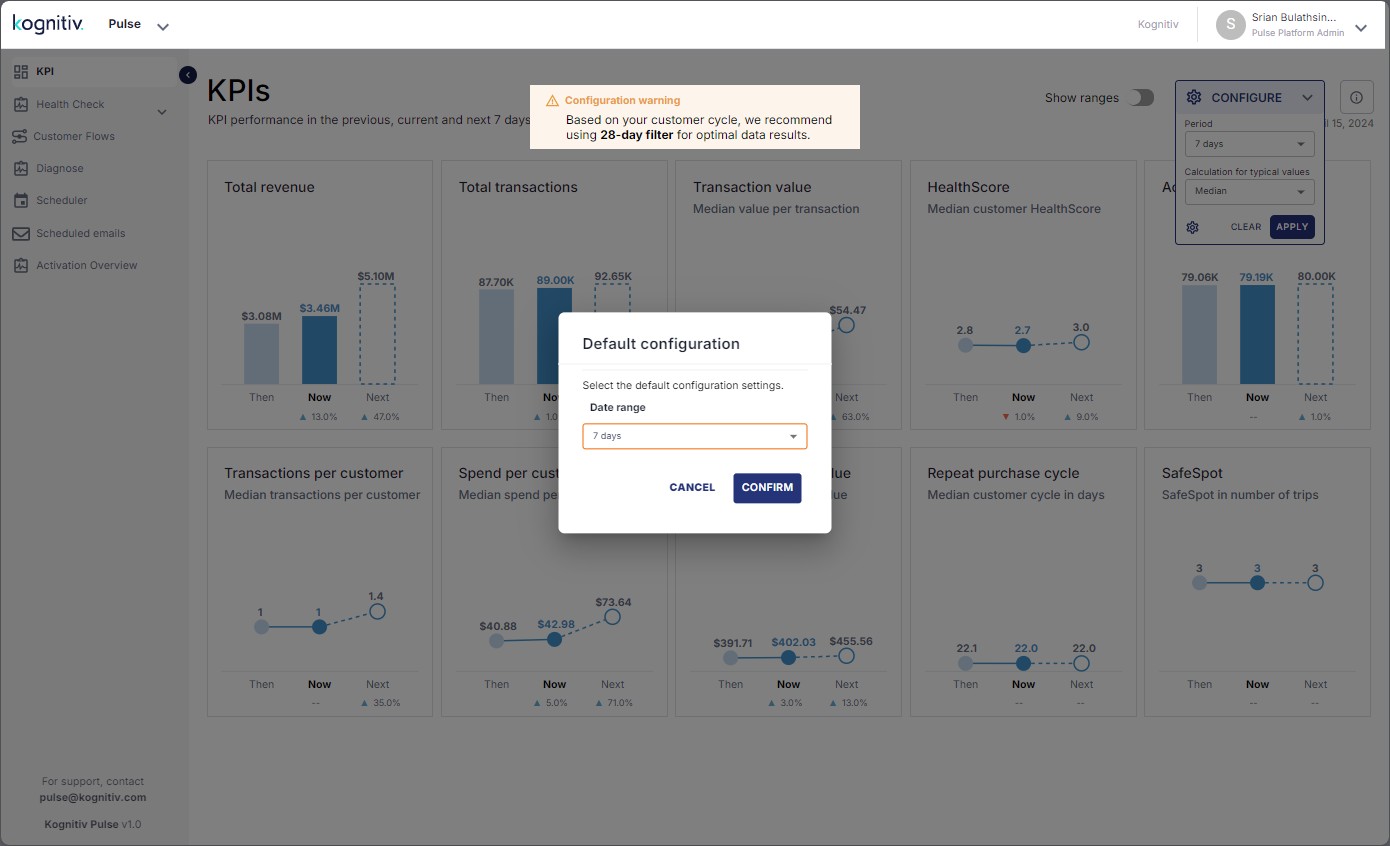
Default Configuration (Warning Message)
Click CONFIRM to confirm setting the selected duration as the default duration for the assessment period. Pulse will return to the CONFIGURE dropdown with the updated duration set in the Period field.
Setting the Display Data
The Calculation for Typical Values dropdown is used for specifying the values (i.e., median or average) displayed in the KPIs page which can be used for median vs. average comparison.
Select Median (this is the default setting) to display the median values in the KPIs page.
KPIs Page (Show Median Values)
Select Average to display the average values in the KPIs page.
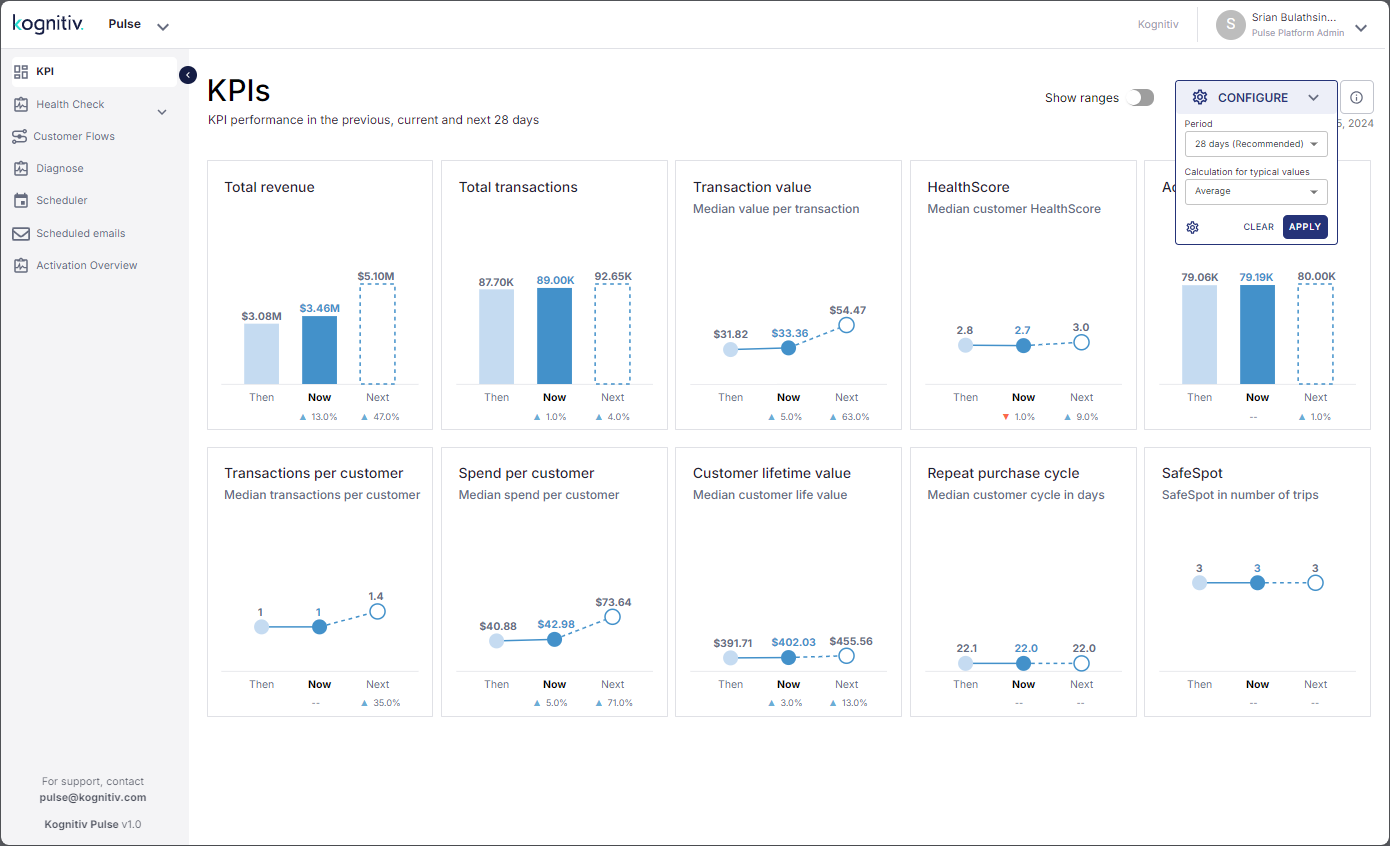
KPIs Page (Show Average Values)
Enable/Disable KPI Ranges Display
The Show Ranges option is used for enabling a percentile analysis of the customer base.
By default, the Show Ranges option will be disabled when the KPIs page. When enabled, Pulse will shade the area taken by the KPI values in order to display the range for the KPIs.
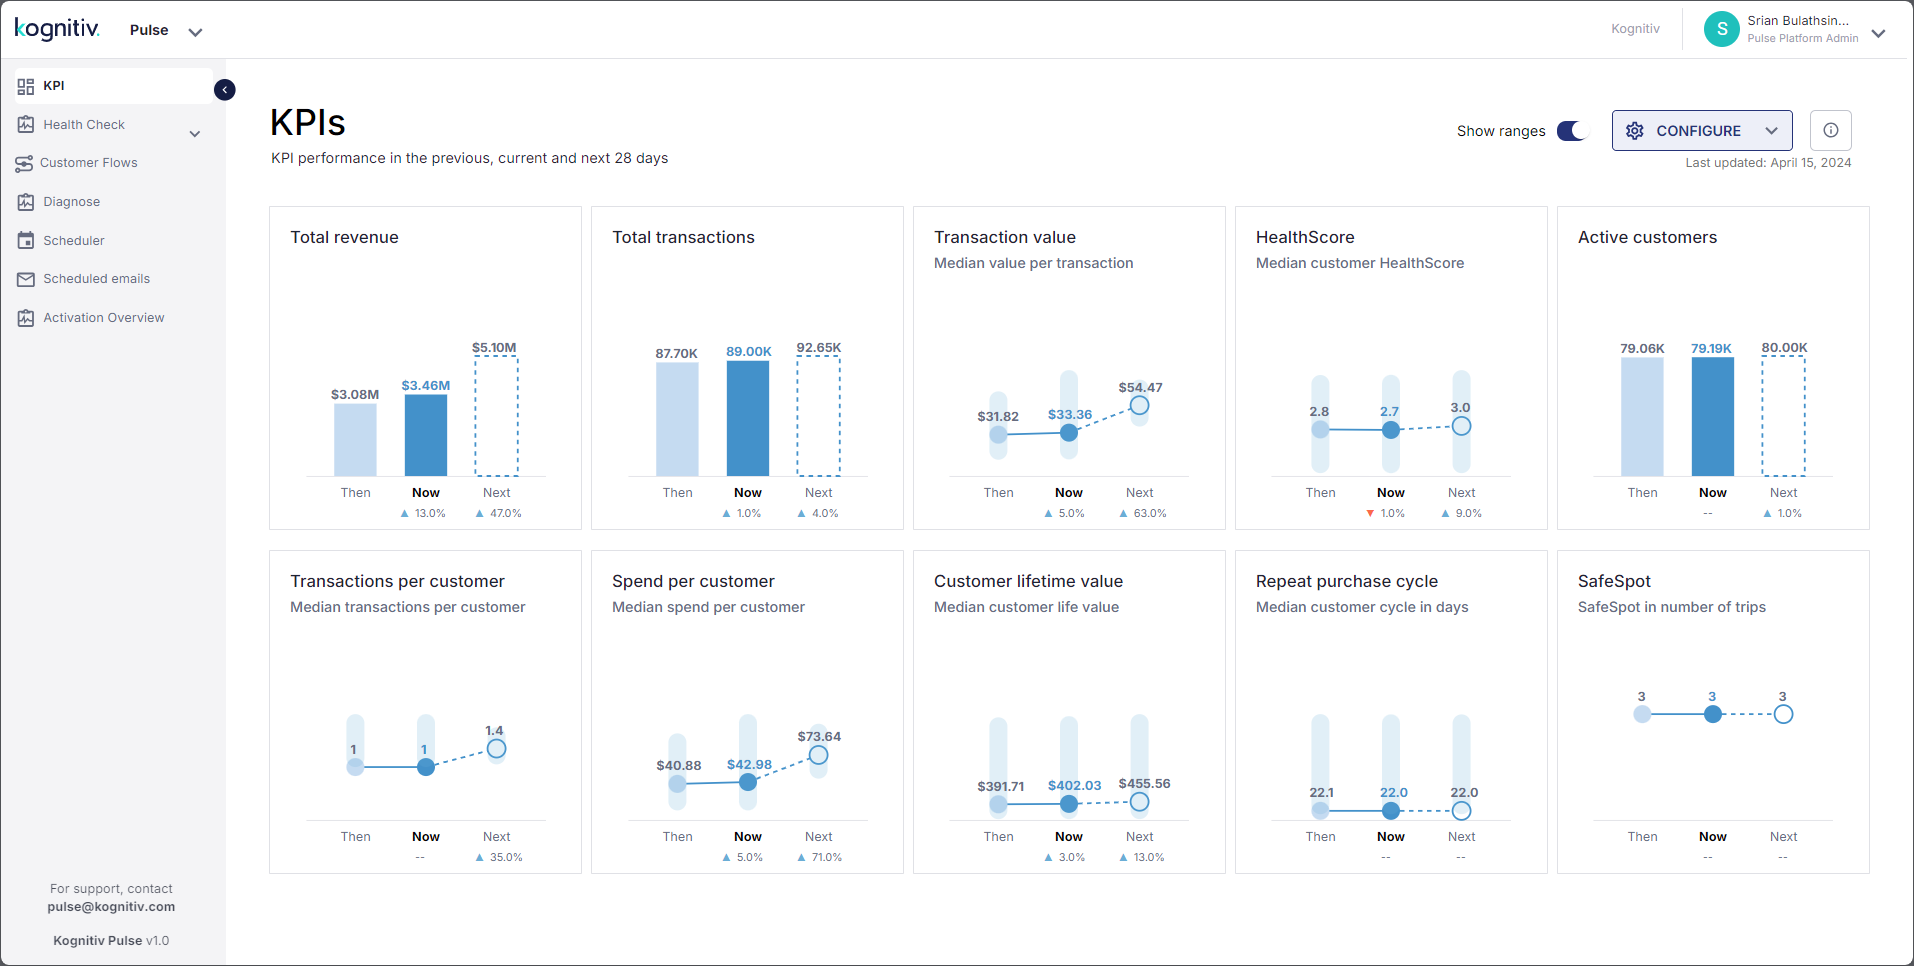
Show Ranges Enabled
Also, the balloon popup displayed when hovering over the KPI will include the values of the middle 90% of the data (from the 5th to the 95th percentile).
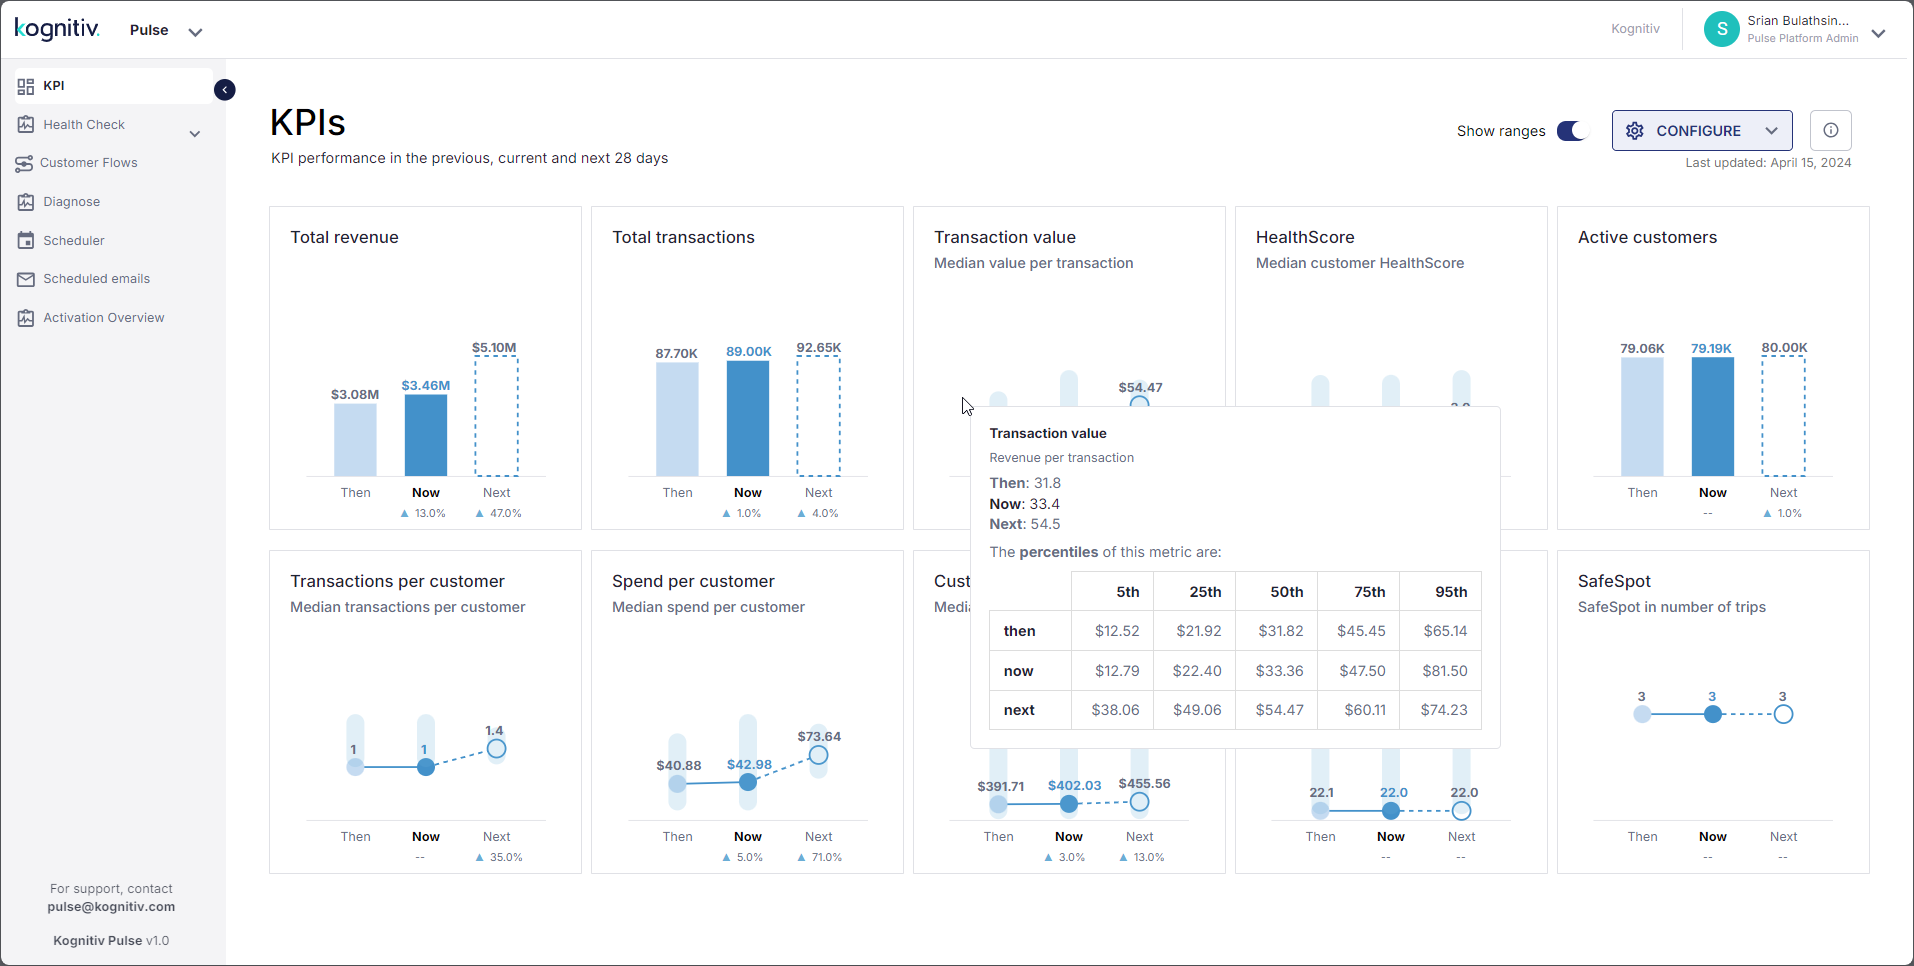
Show Ranges Enabled (Balloon Text)