Customer Flows
- 08 Nov 2024
- 5 Minutes to read
- Contributors

- Print
- DarkLight
Customer Flows
- Updated on 08 Nov 2024
- 5 Minutes to read
- Contributors
- Print
- DarkLight
Article summary
Did you find this summary helpful?
Thank you for your feedback!
Click Customer Flows to open the Customer Flows page.
Customer Flows Page
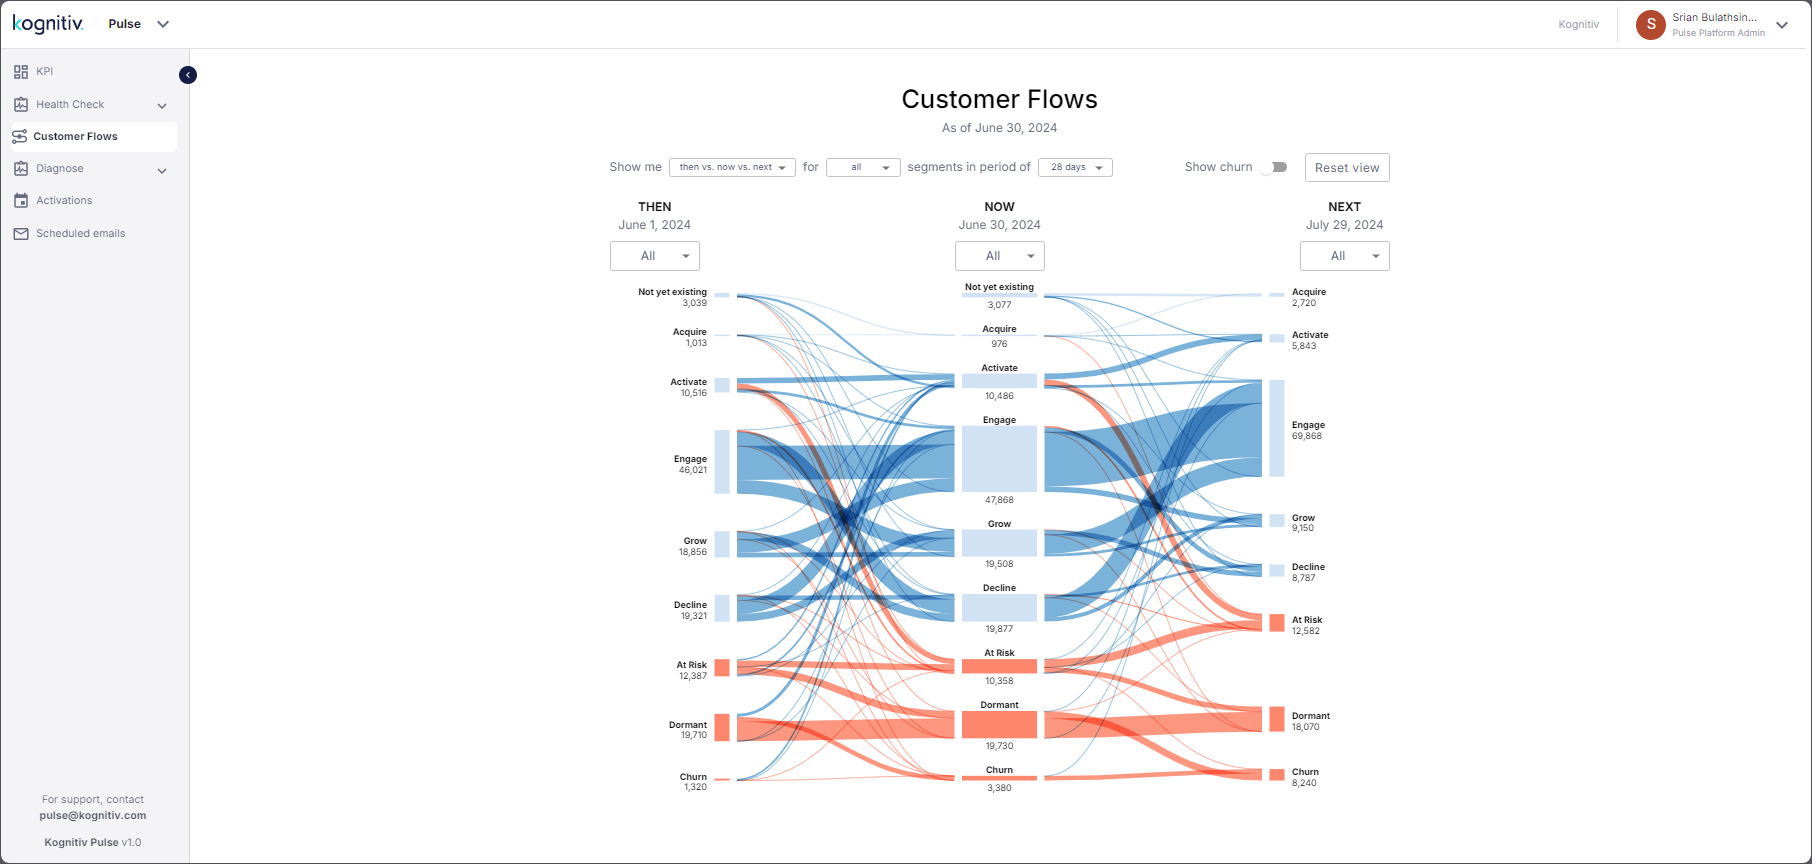
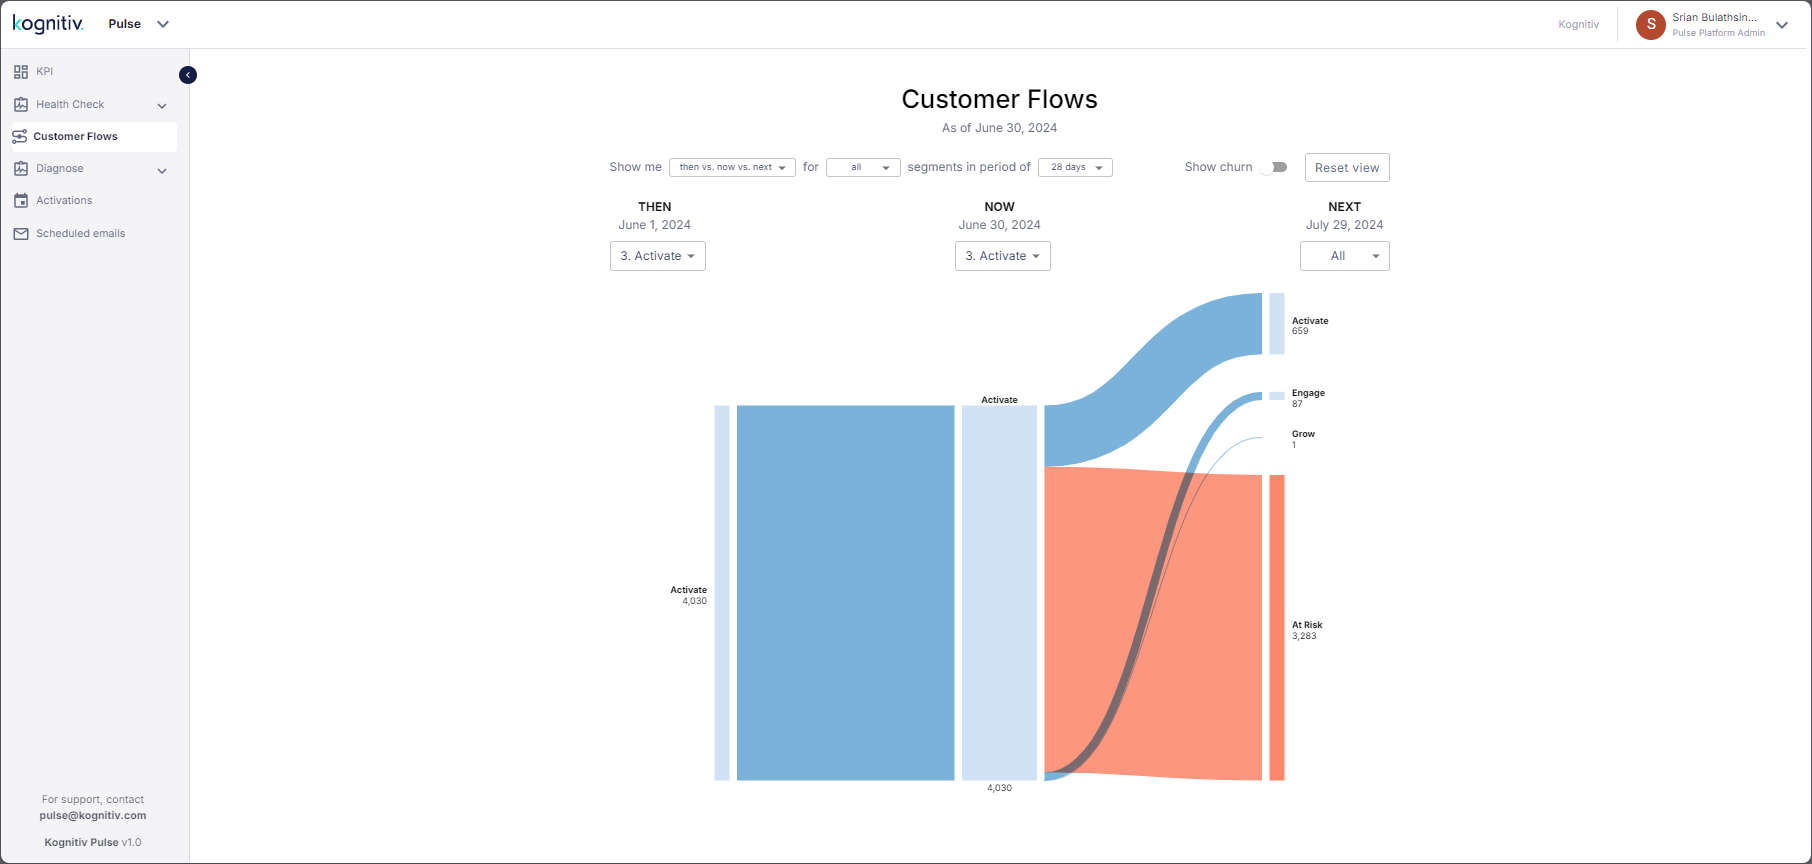
The Customer Flows page displays a Sankey chart showing how the customers belonging to the different SmartJourney® segments moved/transitioned from segment to segment from the last assessment period to the current assessment period and how the customer flows the expected to change within the next period. Additionally, Pulse allows selecting the customers of a particular flow for activation in order to influence the customers for a positive change.
The applicable date for the Sankey chart will be displayed at the top. This will be the date of the last transaction record upload to Data Hub and it will be considered as the last date of the current assessment period.
The Reset View option is used for resetting the the Sankey chart to the default setting. The default view displays the SmartJourney® movements of the past, current and next periods for all customers for a typical 28-day assessment period.
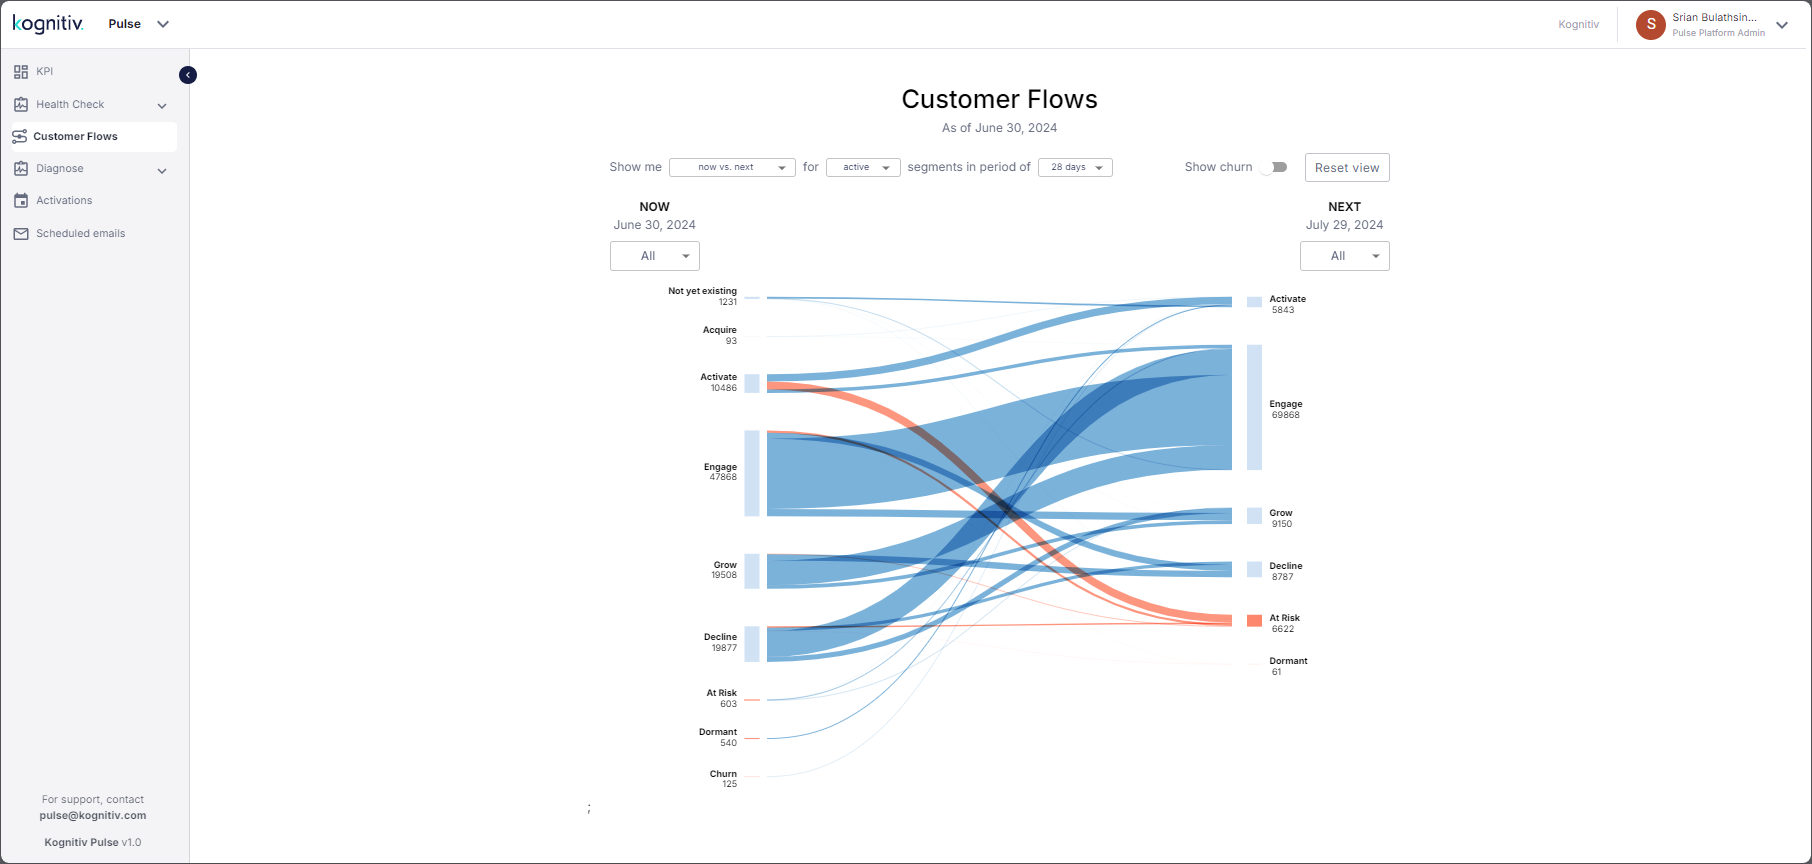
Customer Flows Applicable Criteria
The dropdown menus displayed at the top of the Customer Flows page are used for specifying the criteria applicable to the Sankey chart. These dropdowns specify the periods, the customer status (i.e. active/inactive) and the duration of the assessment period. For instance, to view the flow of the active customers from the current period to the next period, select ‘Now vs Next’ from the first dropdown and ‘Active’ from the second dropdown. Pulse will change the Sankey chart according to the selection.
Include Churned Customers in Sankey Chart
The Show Churn toggle switch is used for including the customers that are in churn in the Customer Flows Sankey chart.
By default, the Sankey chart will only include the customers that were in churn but became active within the current assessment period or predicted to become active within the next period. When the Show Churn option is turned on, Pulse will include the customers that will remain in churn in the Sankey chart.
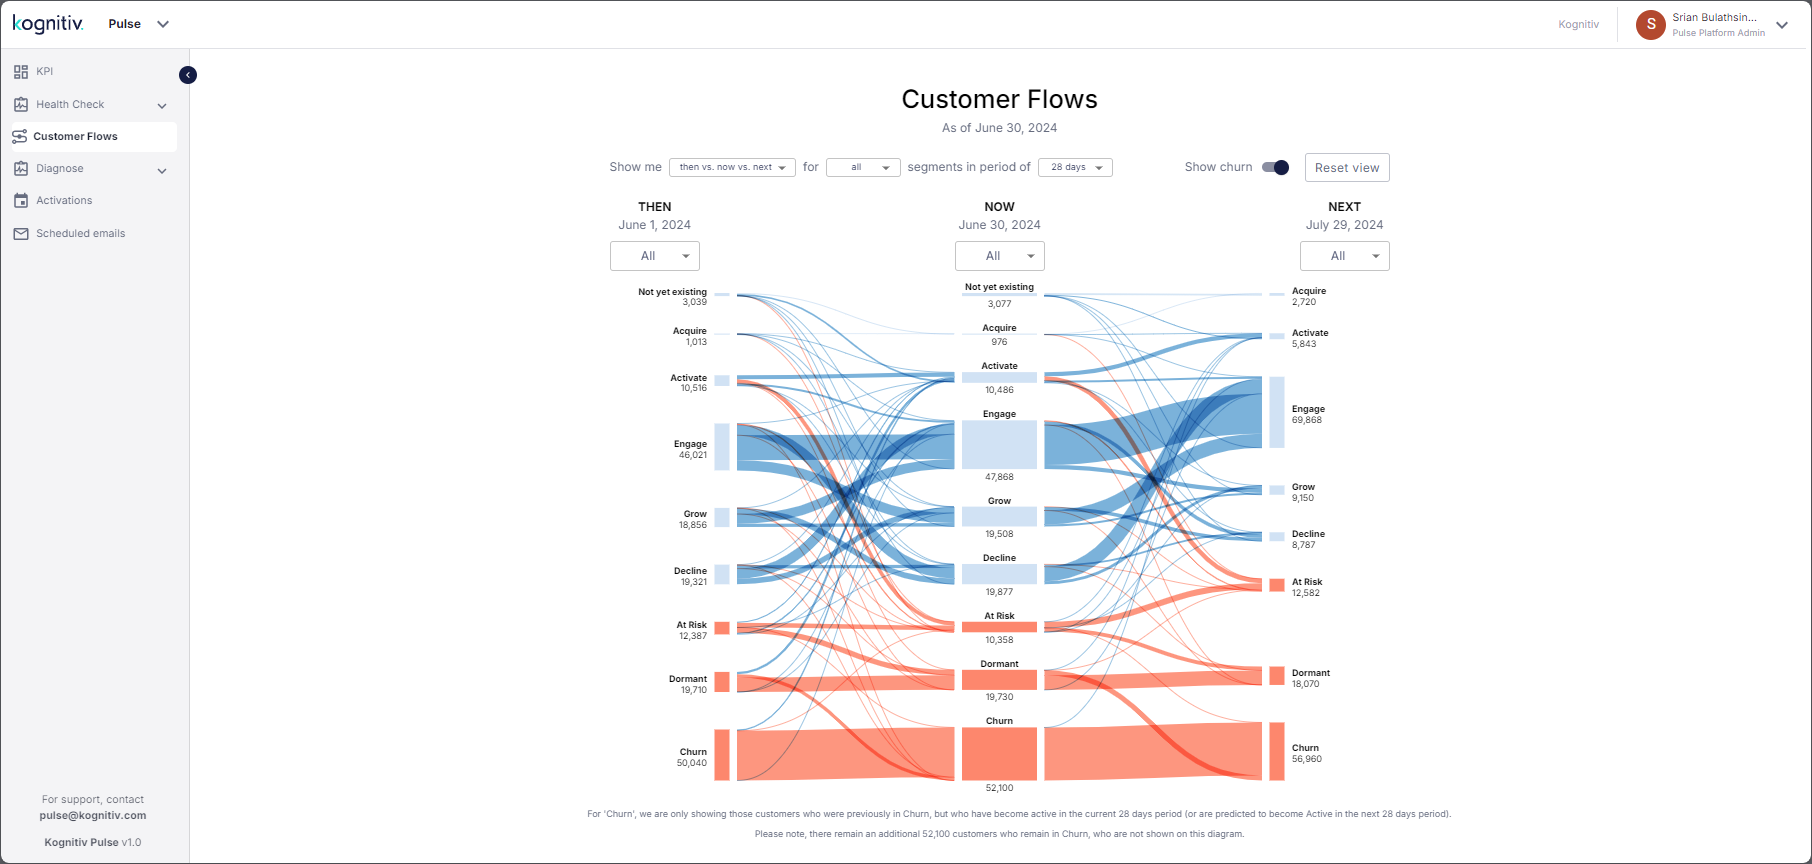
Churn Customers Included in Customer Flows
A message will be displayed at the bottom of the Sankey chart, giving the the count of the customers that are in churn.
Specifying Customer Segments
The dropdown menus under THEN, NOW and NEXT are used for specifying the client segments that are displayed in the Sankey chart.
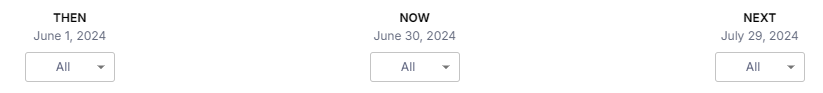
For example, to view the loyalty shifts within the next business cycle applicable to the customers that were active in the past and are currently active, select Activate from the dropdowns under THEN and NOW.
Activating Customers
Pulse allows selecting a group of customers in a specific flow in the Sankey chart to be included in a scheduled activation campaign. The customers will be included in an audience file which then will be used in marketing campaigns via a specified platform downstream. The scheduled activation campaigns will be listed in the Audiences for activation list which can be accessed via the Activations option in the left menu.
To activate, hover over the noodle in the Sankey chart that represents the particular customer flow that needs to be influenced via the activation campaign and Pulse will display the activation card popup for that customer segment.

Activation Card Popup
The popup will display the transition, the customer count and the percentage of those customers from the entire customer base.
Click Activate to open the Predictions grid.
Predictions Grid
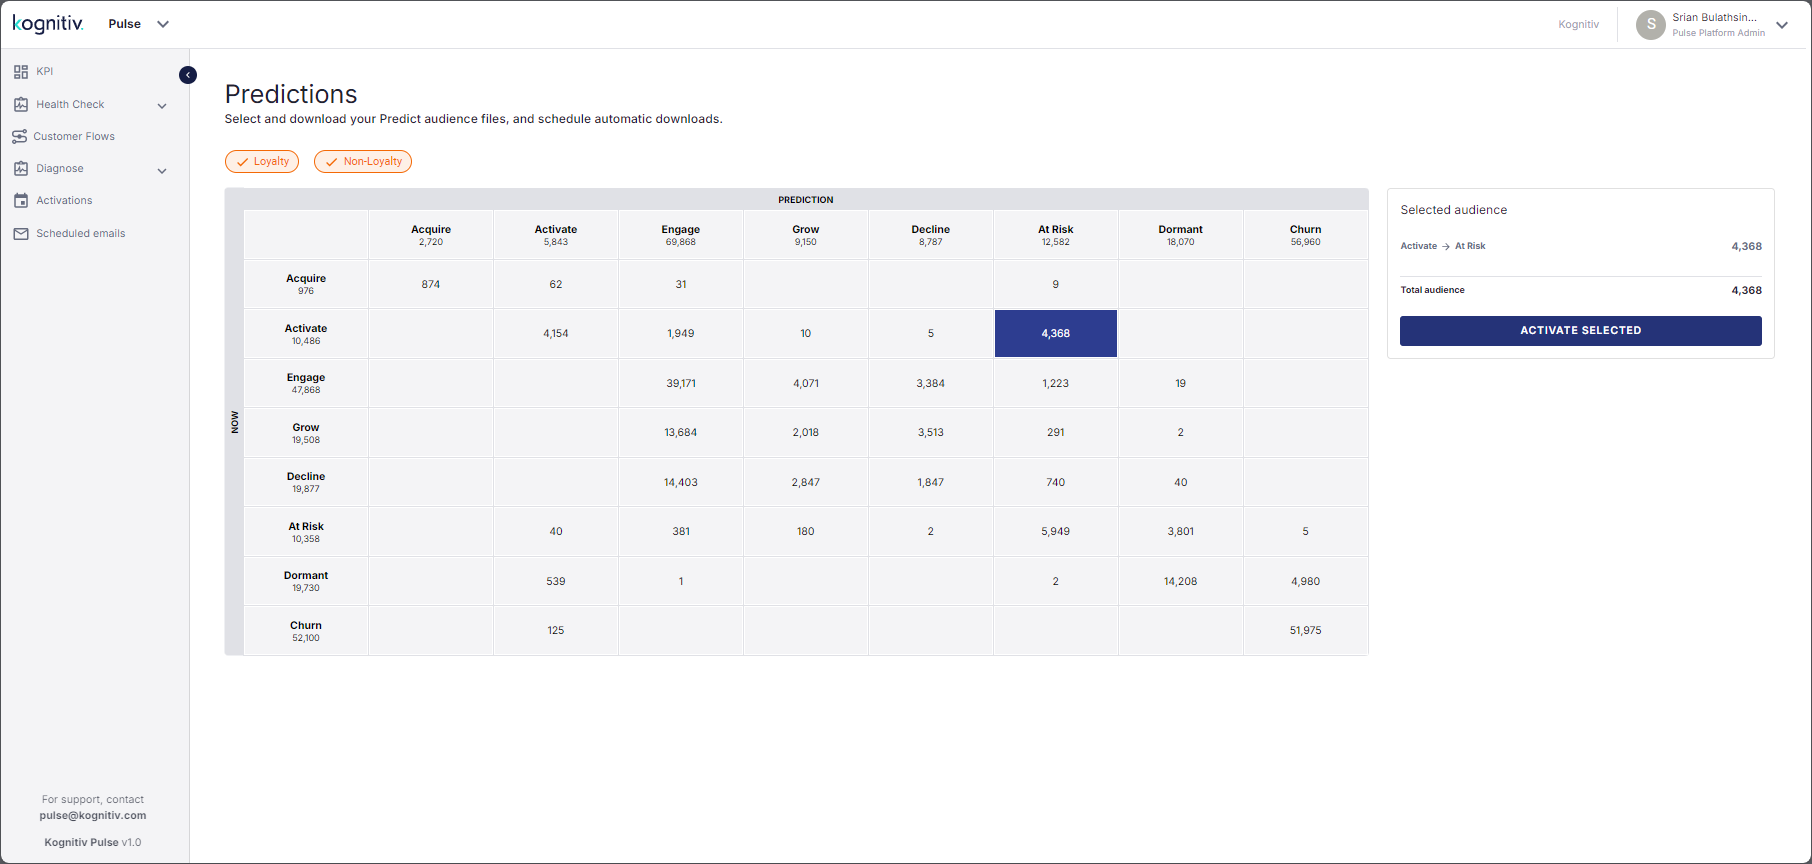
The Predictions grid will display the customer counts belonging to each noodle in the Sankey chart. The vertical axis represents the starting location of the customer flow while the horizontal axis represent the ending location of the transition. Depending on the noodle chosen for activation, Pulse will set the periods in the horizontal and vertical axis of the grid. For instance, if the chosen noodle was a customer transition from the current period to the next period, the vertical axis will be set as NOW and the horizontal axis will be set as PREDICTION.
The customer count of the chosen noodle will be automatically selected. If required, additional customer segments can be selected by clicking the respective cell in the grid. Pulse will dynamically change the Selected Audience section accordingly listing down the selected audiences and their counts and the total audience count. Once the customers are selected, click ACTIVATE SELECTED. This will bring up the Activate an Audience File dialog.
Activate an Audience File Dialog
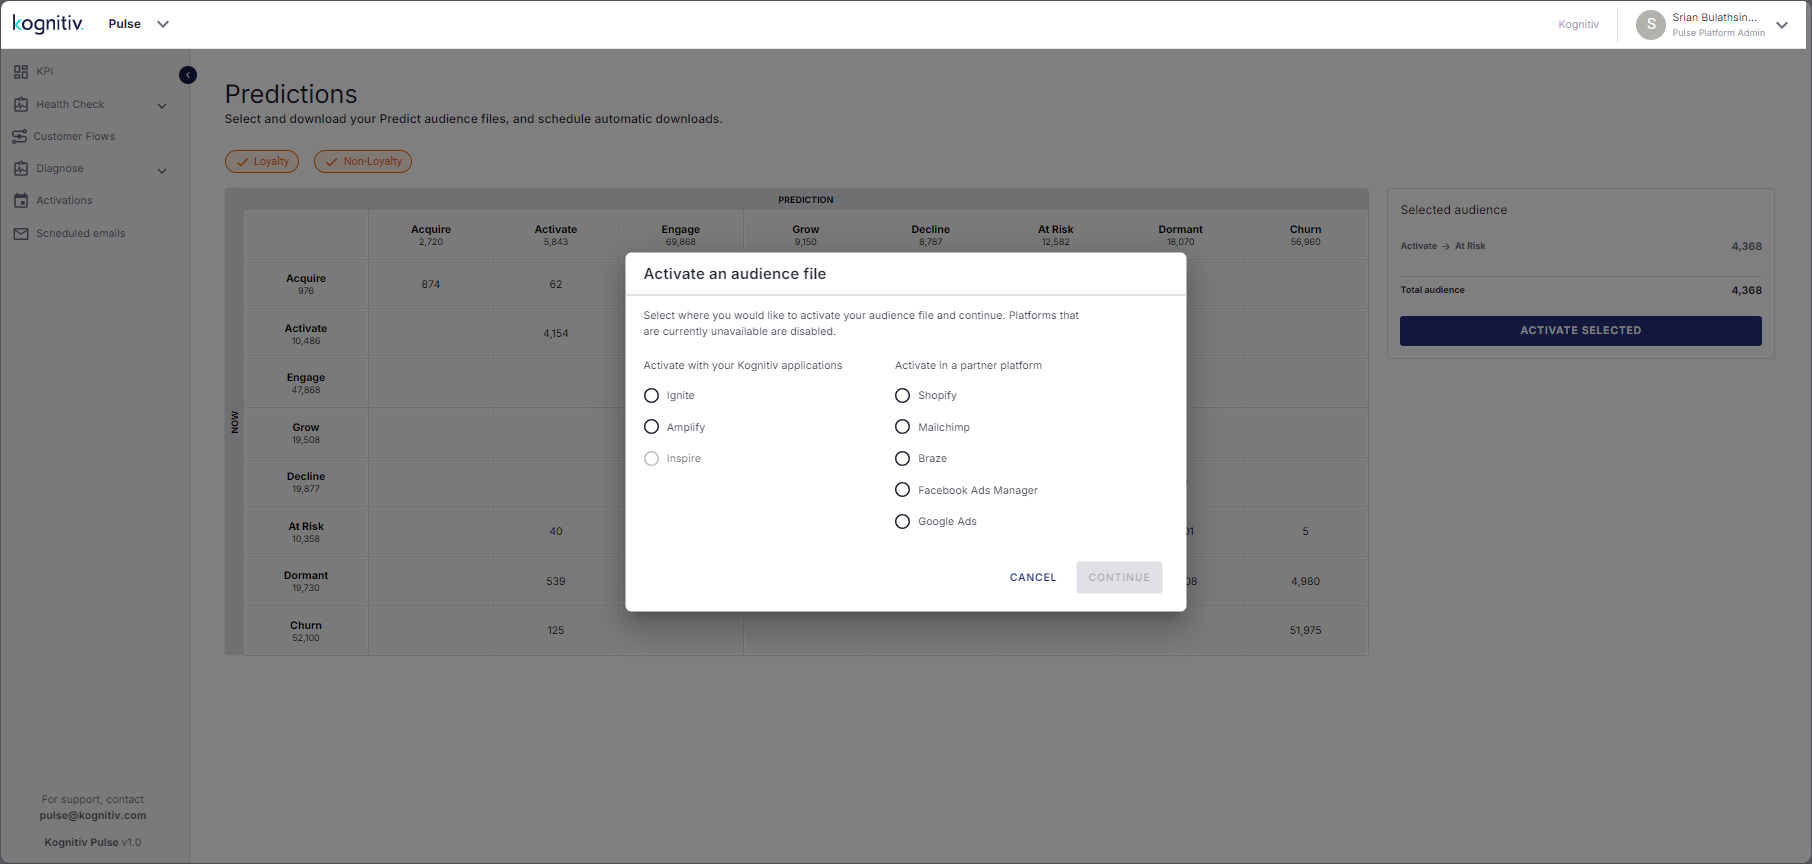
This dialog is used for specifying the platform which will be used for the activation campaign. Pulse will list the activation applications of Kognitiv and third-party applications that have been integrated into the system via the Home application. Select the radio button to select the required activation platform. This will enable the CONTINUE option.
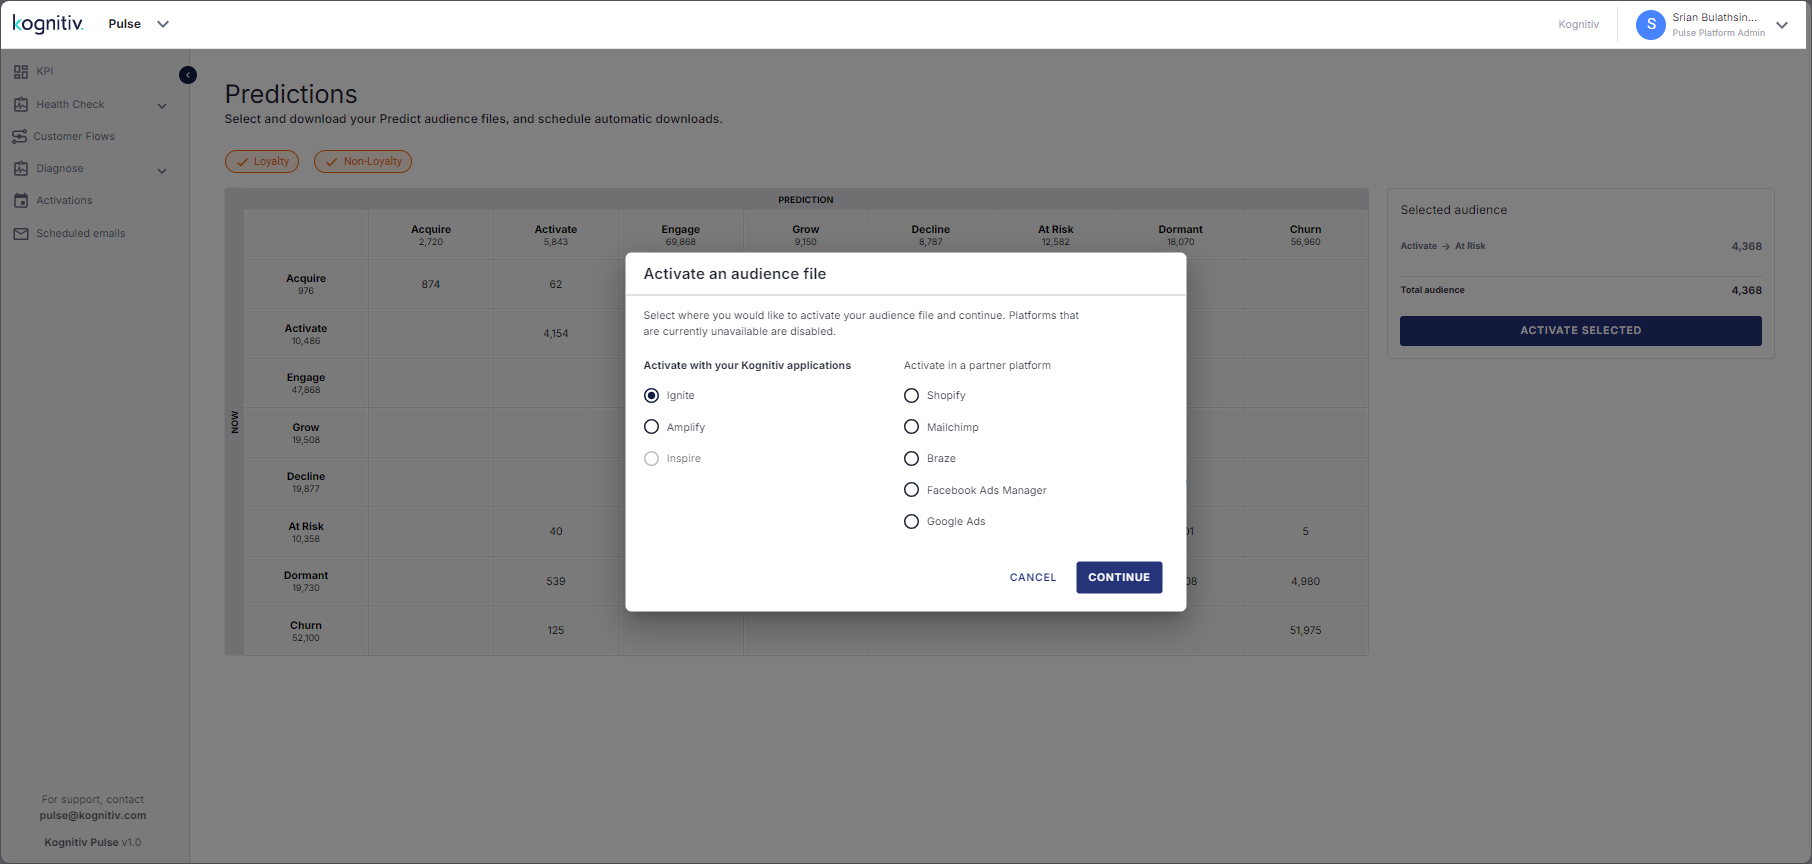
Activation Platform Selected
Click CONTINUE. Pulse will open the audience file set up dialog.
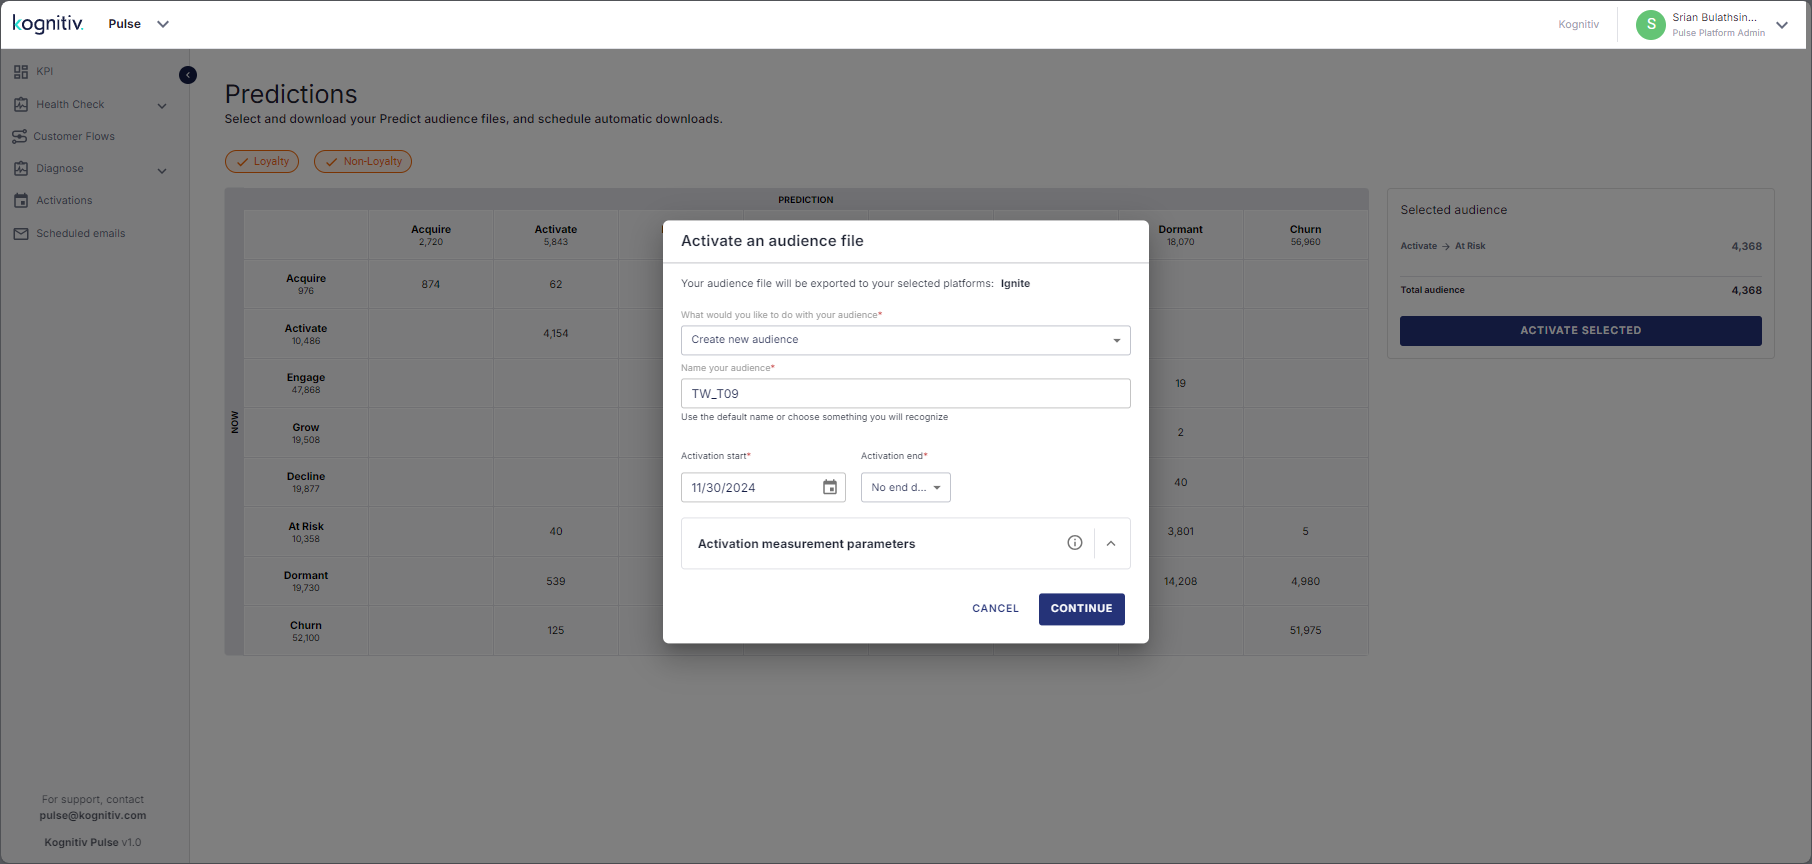
Audience File Setup Dialog
At the top, Pulse will display the name of the activation platform which will be consuming the audience file.
Select Create new audience to create a new audience file with the customers.
Specify the name of the audience file in the Name your audience field.
Specify the duration of the activation campaign via the Activation Start and Activation End fields. By default, Pulse sets the current date in the Activation Start field which could be changed using the date picker control. If the activation campaign needs to be carried out for a specific duration, specify the end date. If the campaign needs run indefinitely, select No end date from the Activation End dropdown.
Pulse will split the campaign audience into two groups, where one group will be used in the campaign (test group) while the other group will be set aside as the control. This allows Kognition AI/ML engine to measure the shift in the customer behavior due to the activation and provide a report on the campaign performance.
Click CONTINUE to move to the next screen to define the campaign frequency.
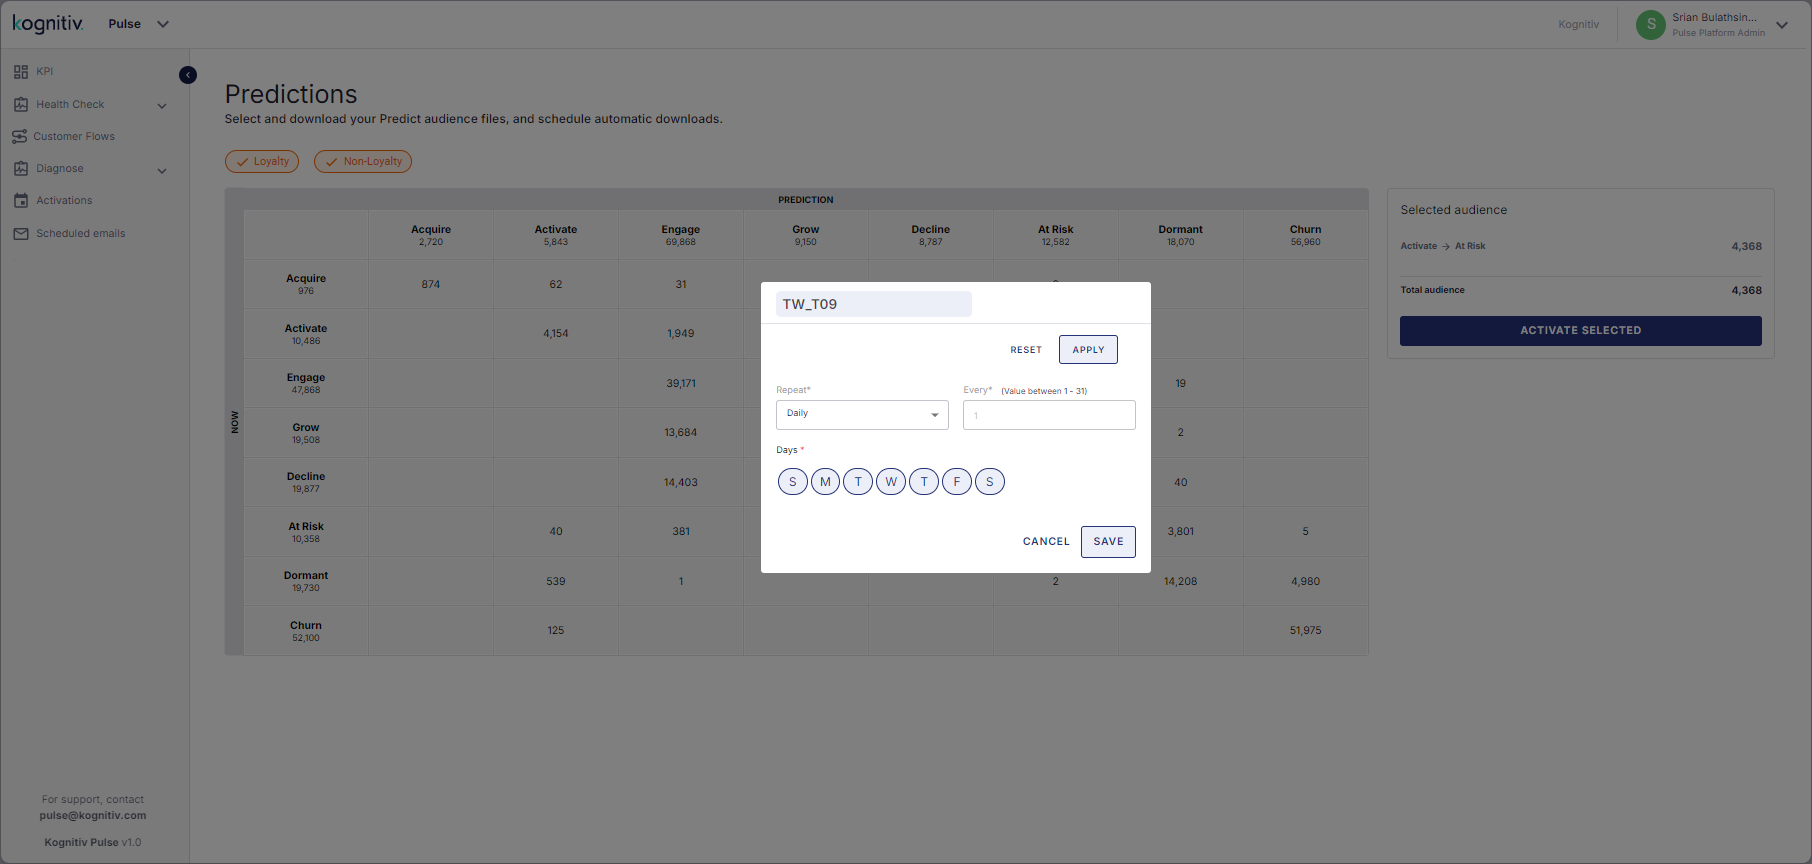
Activation Campaign Frequency Definition
At the top, the name of the audience file will be displayed.
Pulse allows setting the activation campaigns to be repeated daily, weekly or monthly using the Repeat dropdown.
To run the process daily, select Daily and specify the number of days which the scheduled process needs to run.
If Weekly is selected, then specify the number of cycles and also on which day/s of the week the process needs to run by selecting the letter representing the day name (by default, the system will have all seven days of the week enabled).
If Monthly is selected, specify the which day of the month the process needs to run and the number of repetitions.
Once the activation schedule is set up, click SAVE to save. Pulse will exit from the scheduled activation creation flow and display a save success message.
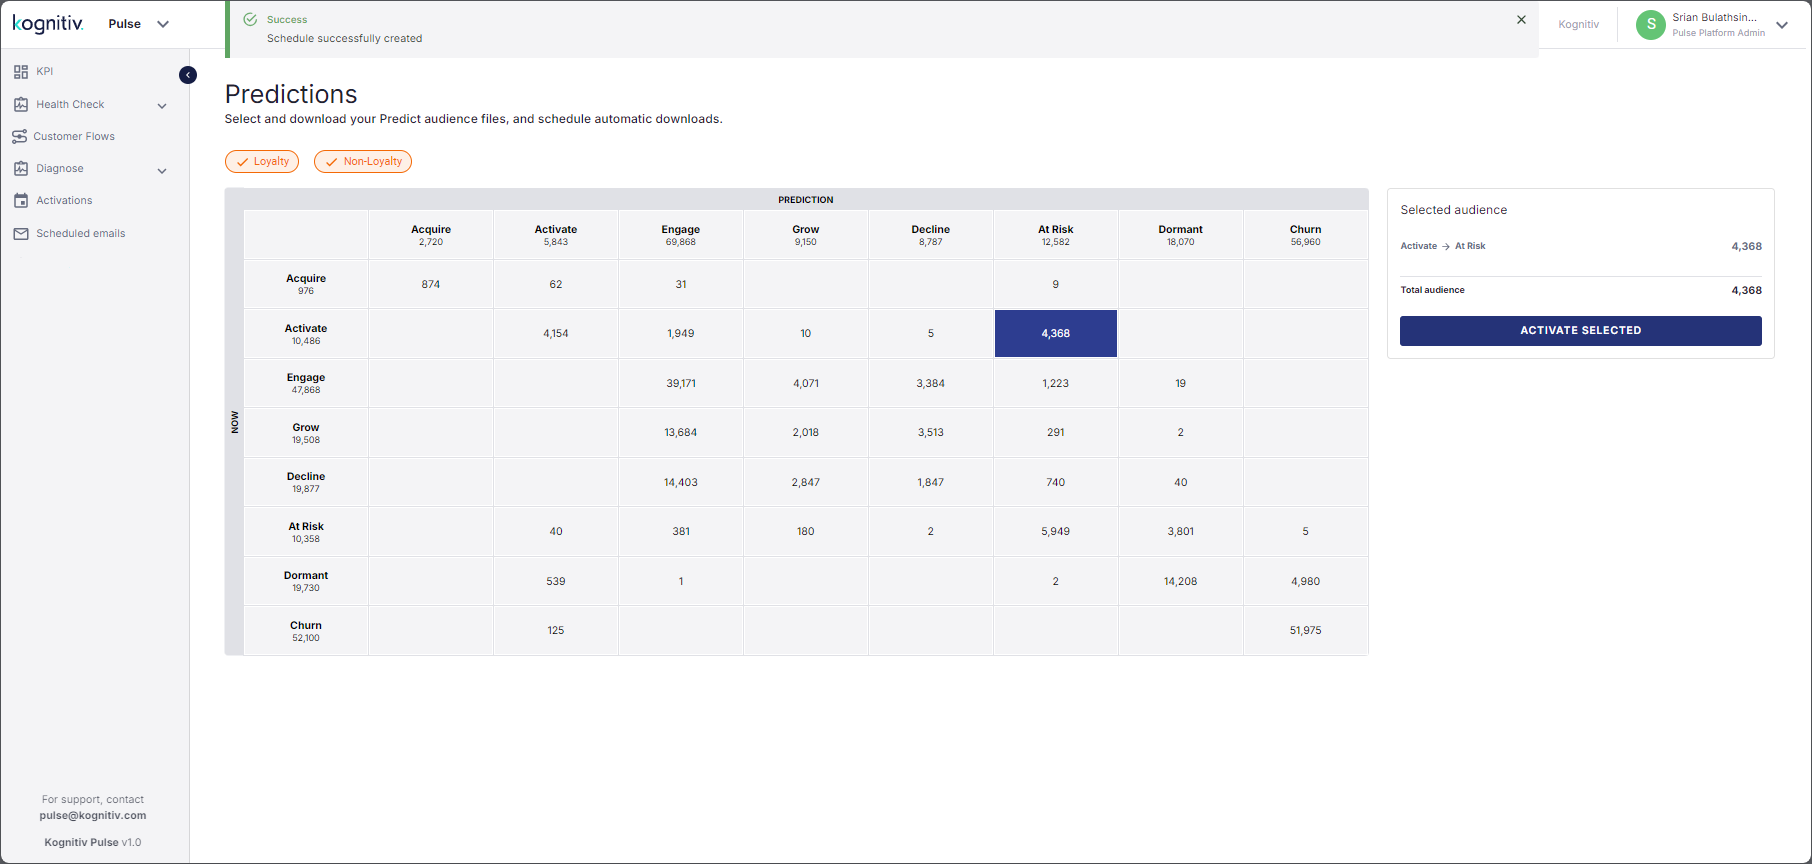
Scheduled Activation Success Message
The newly added activation schedule will be added to the Audiences for activation list which can be accessed via the Activations option in the left menu.
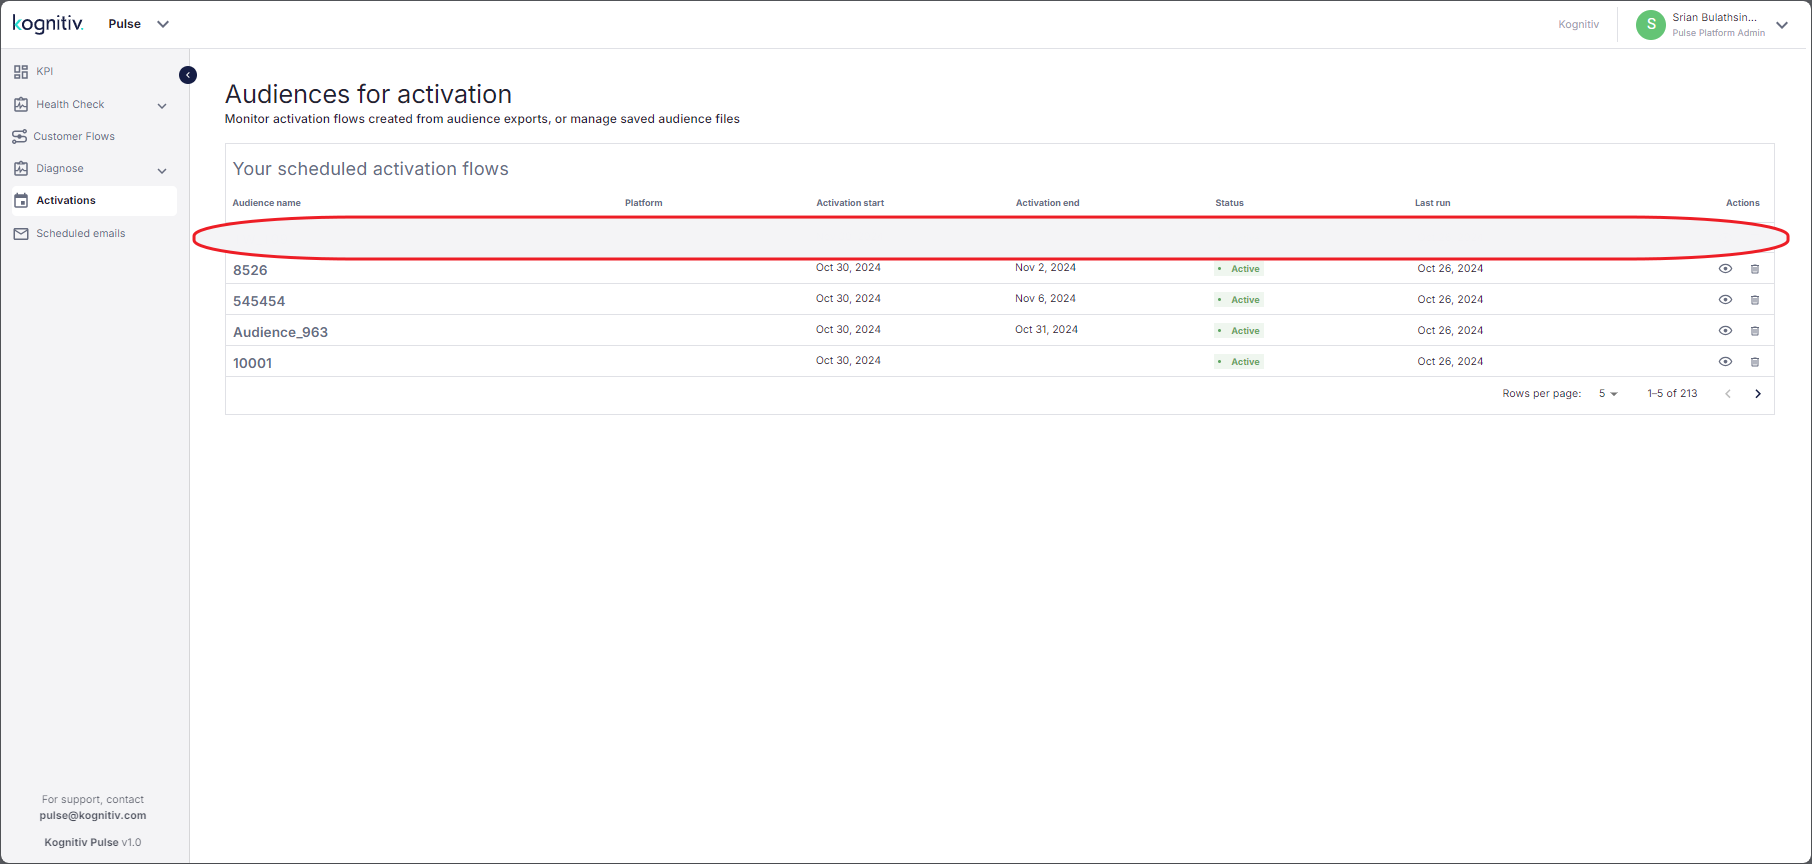
Audiences for Activation List
Was this article helpful?