Health Check
  • 13 Sep 2024
  • 6 Minutes to read
  • Contributors
  • Dark
    Light

Health Check

  • Dark
    Light

Article summary

Click Health Check to open the Health Check page.

Basic_View_Customer_Counts

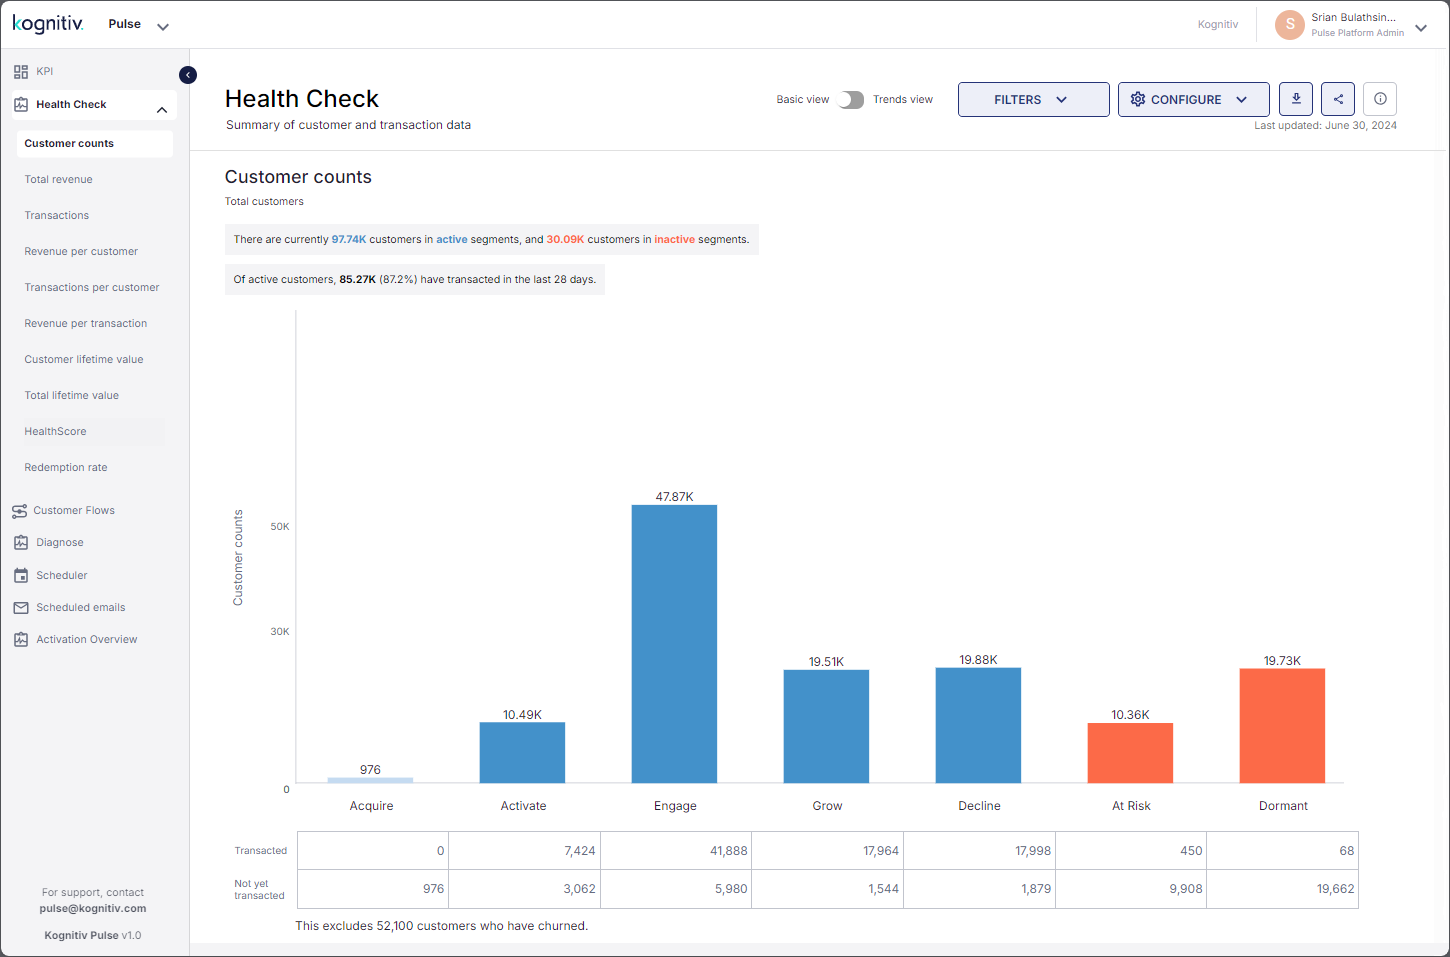
Health Check Customer Counts Report (Basic View)

The Health Check page consists of data visualization reports that analyzes the health of the customer base. The data visualizations in the Health Check page are based on key mastics that Pulse use for measuring the customer base health. The reports will have the customer base segmented according to SmartJourney® customer segmentation for in-depth analysis.

There are two modes, namely the Basic View (See Health Check - Basic View) which provides data visualizations displaying the current status of the customer-brand relationship health, and the Trends View (See Health Check - Trends View) which provides a forecast on the customer base health for the next period, based on the trends followed by the same metrics during the previous period and current period. The Basic View/Trends View toggle control at the top allow switching between the two modes. By default, the Basic View will be displayed first when the Health Check page is loaded.

The Health Check reports are based on the transaction data uploaded to the system. The date of the last data upload will be displayed in the Last Updated field at the top and this date will be considered as the last date of the current period.

Pulse will exclude the customers that are in Churn segment as their transactions are not within the current assessment period. The number of customers in Churn will be displayed at the bottom of the reports.

Filtering Data Visualizations

The FILTERS dropdown lists the options used for filtering the data displayed in the Health Check reports.

HEALTH_CHECK_FILTERS

Health Check FILTERS Dropdown

Select the required filters from the dropdown and click APPLY to apply the selected filters on the Health Check reports. Pulse will update data visualizations and display only the filtered data. By default, all data will be enabled in the reports.

The following filteration options are available in the FILTERS dropdown.

Filter

Description

Loyalty/Non-Loyalty

Filter the customers according to their loyalty program membership status. By default, both loyalty and non-loyalty customers are displayed in the data visualizations.

Country

Filter the data in the visualizations by a specific country/store location.

Region

Filter the data in the visualizations by a specific region.

Loyalty Tier

Filter the data in the visualizations according to a specific loyalty tier.

Client Segmentation 1/2/3

Filter the data according to specific segmentation criteria used by the brand to segment it’s customers.

Configuring the Data Displayed in the Visualizations

The CONFIGURE dropdown is used for specifying the data that is being displayed in the Health Check data visualizations.

HEALTH_CHECK_CONFIGURE

Health Check CONFIGURE Dropdown

Choosing the Assessment Period for Health Check Reports

The Choose Period dropdown is used for selecting the duration of the period for assessing the customer-brand relationship. The default evaluation period duration in Pulse is set to 28 days. The other durations available for selection are, 7 days, 91 days and 182 days.

HC_CONFIGURE_Choose_Period

Health Check Configure Choose Period Dropdown

By analyzing the data uploaded to the system, Kognition will deduce the customer cycle duration for the customer base and based on the customer cycle duration, Pulse will recommend the duration for the assessment period for the best analysis and most relevant information on the customer base health. The customer cycle will be used in segmenting the customers according to SmartJourney categorization based on each customer’s engagement level with the brand within the selected assessment period. A shorter assessment period is suitable if the customer cycle duration is low, while a longer assessment period is recommended if the customer cycle duration is high.

Select the duration for the assessment period from the dropdown. A warning message will be displayed on the screen if the selected duration is unsuitable for assessing the customer base.

HC_CONFIGURE_Choose_Period_Warning

Health Check Choose Period Warning

However, Pulse will allow applying the selected duration on the Health Check reports. Click APPLY to apply the chosen duration as the assessment period and Pulse will update the Health Check reports accordingly.

Setting a Default Assessment Period

The Default Configuration feature which can be accessed via the gear icon in the CONFIGURE dropdown menu is used for setting a default duration for the assessing the customer-brand relationship health in the Health Check reports. This will enable Pulse to load the Health Check page with the specified duration for the particular user account.

HC_CONFIGURE_Default_Configuration

Health Check Report Default Configuration

Click the gear icon to open the Default Configuration dialog.

HC_CONFIGURE_Default_Configuration_Dialog

Health Check Default Configuration Dialog

The Date Range dropdown menu lists the durations used in Pulse for customer-brand relationship assessment. Select the preferred duration from the list. Pulse will display a warning message if the selected duration is not suitable for measuring the customer base health.

HC_CONFIGURE_Default_Configuration_Date_Range_Warning

Health Check Default Configuration Warning

Click CONFIRM to confirm using the selected duration as the default assessment period. Pulse will close the Default Configuration dialog and return to the Health Check page.

Show/Hide Actual Revenue & Transactions by Inactive Customers

The Show for Inactive Segments dropdown is used for enabling Pulse to display the number of positive transactions and the revenue generated by customers that are deemed as inactive within a given assessment period.

In a case where the assessment period is set for 28 days for a customer base that has a customer cycle of two (02) days, Pulse would group customers who have made purchases on the first day of the assessment period but since then have been inactive (remainder of the 28 days), in the At-Risk segment or in the Dormant segment (if they were inactive for more than one assessment cycle) according to SmartJourney segmentation methodology. This would ignore the revenue generated and the transaction count of such customers in the Health Check report for that particular assessment period. When enabled, Pulse would include the actual revenue generated and the transaction count of the customers that are in the inactive segments in addition to displaying the lost revenue and transactions of those segments. By default, only the feature is only the lost revenue and transaction details will be displayed.

The lost revenue is the revenue which would have been generated in case the customers behaved ideally (i.e., if the customers continued to spend on the brand) instead of being inactive after making positive transactions. The lost transactions is the number of transaction that would have been completed if the customer behavior did not change.

This feature is only applicable to the Total Revenue and Transactions visualizations in the Health Check page. Pulse will display a screen message to indicate that when the Show for Inactive Segments setting is changed.

Select Lost Only (this is the default setting) and click APPLY to display only the lost revenue in the Total Revenue chart and the lost transactions due to inactive customers in the Transactions chart.

HC_Total_Revenue_Lost_Only

Show Lost Only (Total Revenue Report)

HEALTH_CHECK_CONFIGURE_Lost_Only

Show Lost Only (Transactions Report)

Select Lost and Actual and click APPLY to view a breakdown of the actual revenue generated by the before the customers became inactive and the lost revenue in the Total Revenue report and the Transaction report will include the actual transaction count and the lost transactions.

HEALTH_CHECK_CONFIGURE_Lost_and_Actual


Was this article helpful?